What's New in Tenet v0.2
Quality-of-life improvements, cell-based trace visualization, and more...
Tenet is an IDA Pro plugin which enables reverse engineers to explore execution traces of native code. It is a testbed for evaluating how omniscient traces might facilitate new and innovative debugging experiences, improving the speed of software comprehension in reverse engineers and developers alike.
In this post, we’ll be covering some of the updates that made their way into the v0.2 release of Tenet. As the first ‘major’ update to Tenet, the goal was to fix several quality-of-life issues and improve its general usability. Like any new project, there will be some growing pains as the project begins to find its feet.
For more background information about Tenet, please see the post about its initial release.
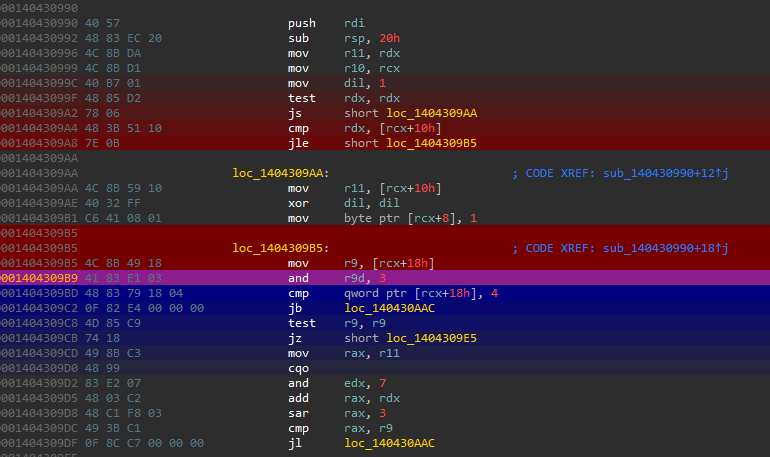
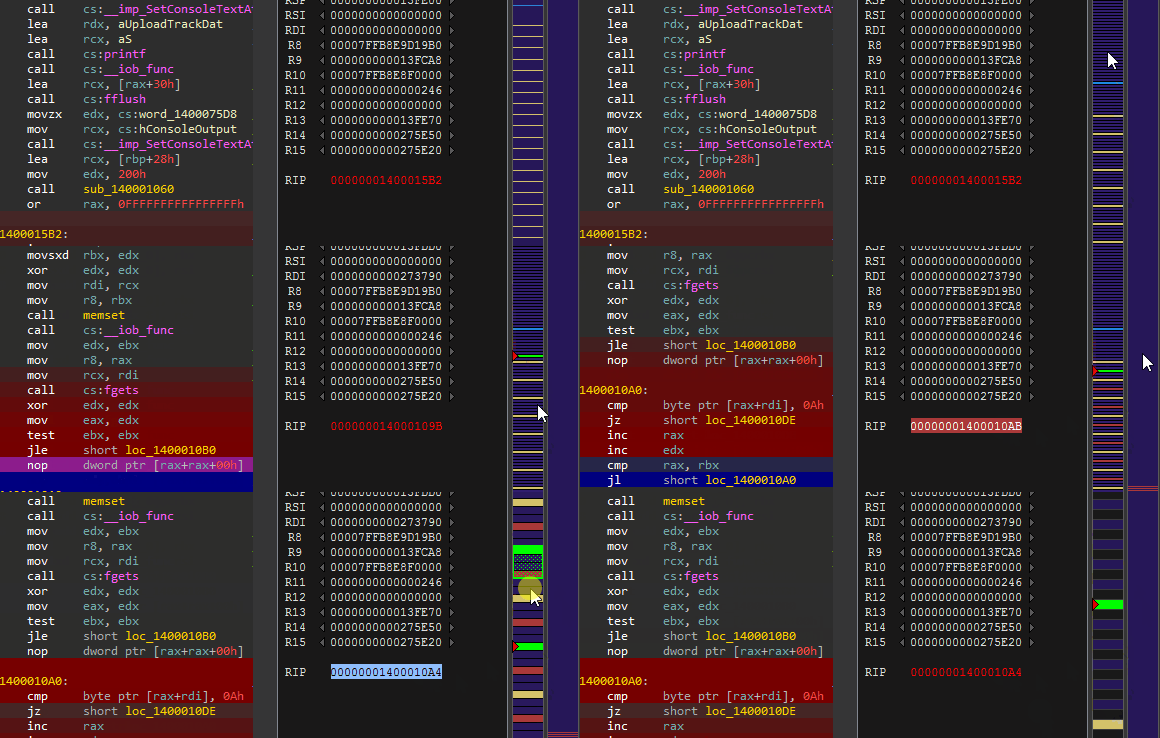
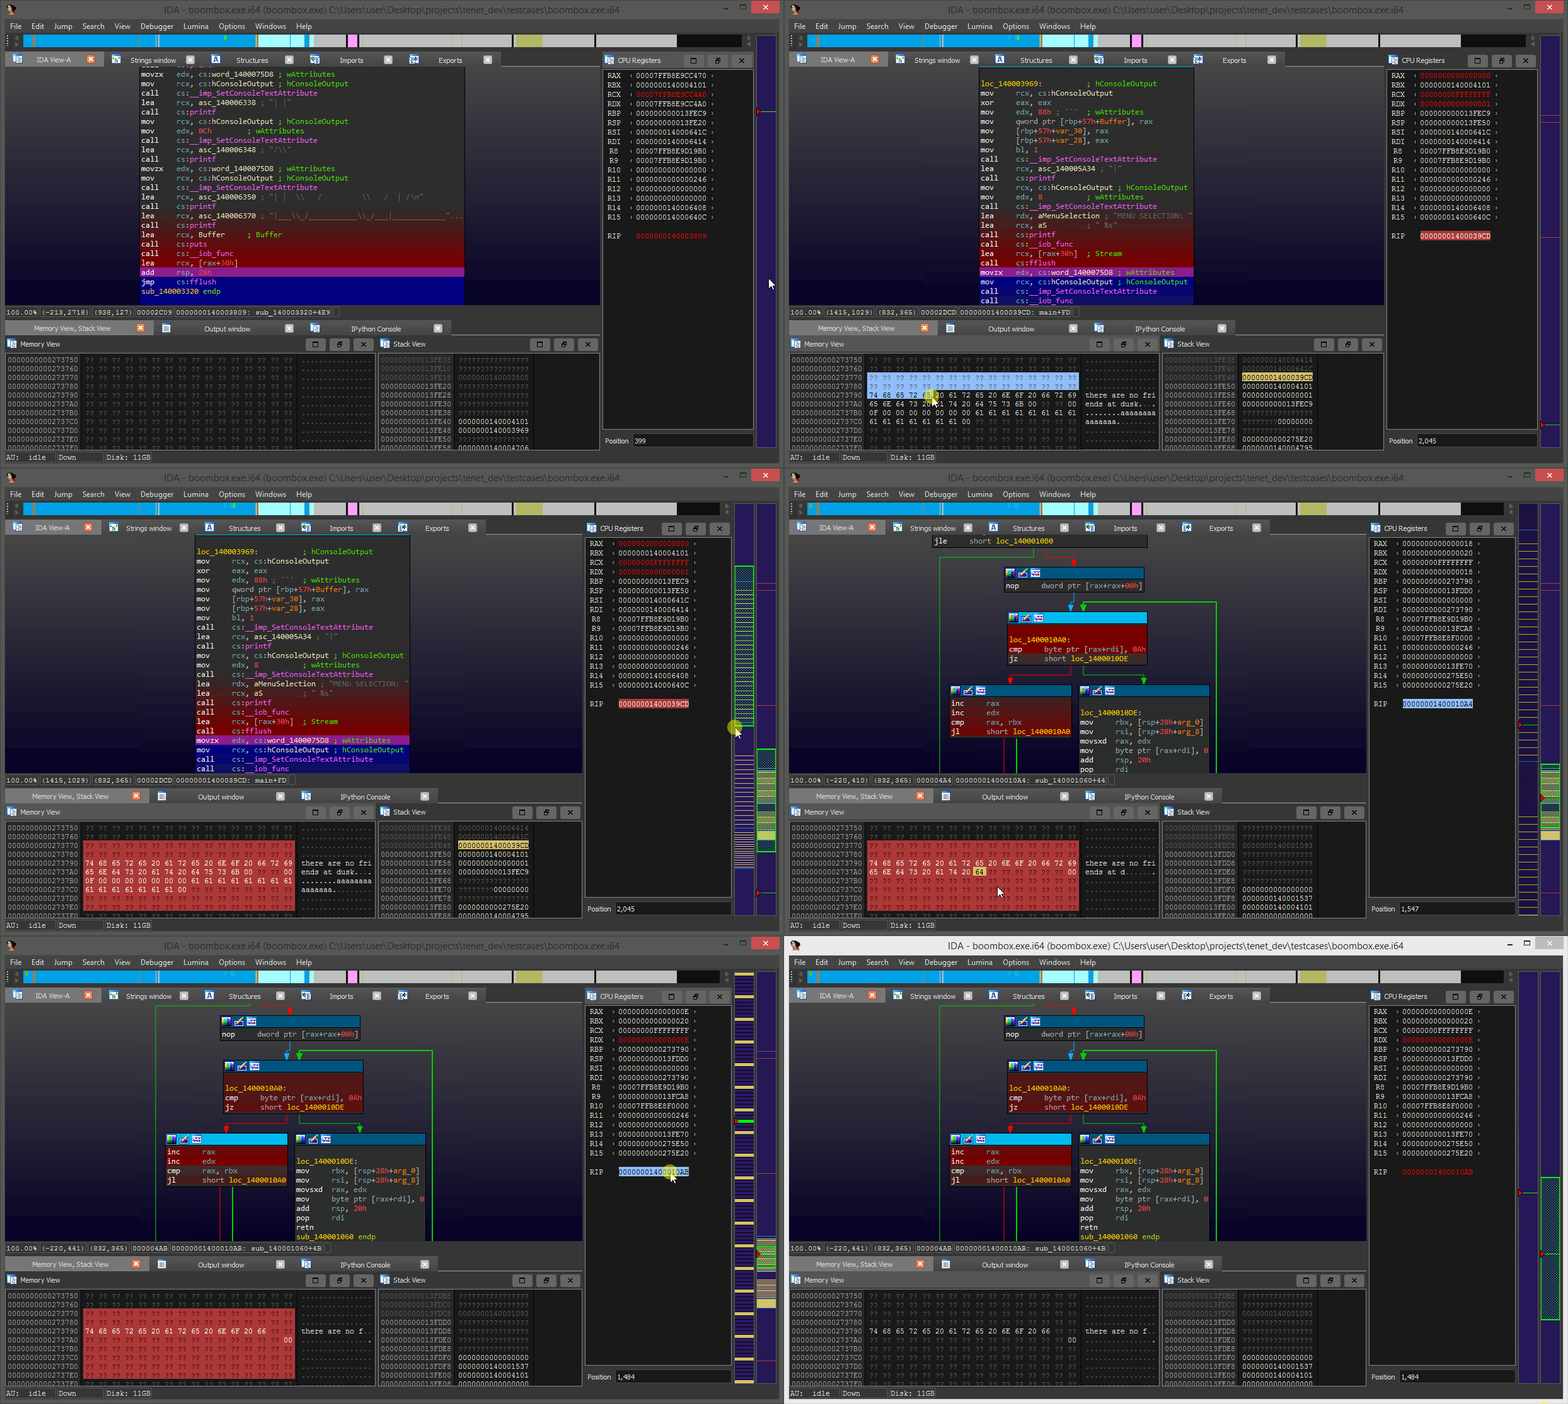
Cells of Execution
The first and most striking change included in the v0.2 update has to do with Tenet’s interactive trace timelines. There is a new ‘cell-based’ drawing mode that activates once the instruction ‘density’ falls beneath a certain threshold. In other words, if you ‘zoom in’ enough on the tracebars, you can start to see the individual ‘cells’ of execution:
While this feature is mostly for fun, it is meant to attach some kind of tangible structure to the fundamental element of execution: a single executed instruction. Is it useful? Maybe, maybe not. Tenet is simply an experiment to play with new ways of observing software execution.
What will be the next structure of execution worth visualizing?
Automatic Imagebase Resolution
After loading a trace, Tenet will now perform some basic analysis of the executed addresses to identify which regions of memory appear to couple tightly with the open IDA database. This is used to automatically compute the ASLR slide between relevant traced addresses, and the static imagebase.
Automatically resolving the ASLR slide means that Tenet will be able to follow traces without the annoying requirement of having to rebase your database onto the runtime addresses captured in your trace.
Unmapped Trace Regions
While it is strongly recommended that you ‘filter’ your traces, Tenet now colors ‘un-explorable’ trace regions gray. These are parts of the trace that do not seem to correspond to the executable opened in IDA, and thus cannot be navigated to.
In addition, Tenet will no longer jump IDA ‘wildly’ all over the place when stepping through these regions. Instead, it stays fixed on the instruction which caused the entry into the unmapped region.
Improved Breakpoint Selection Model
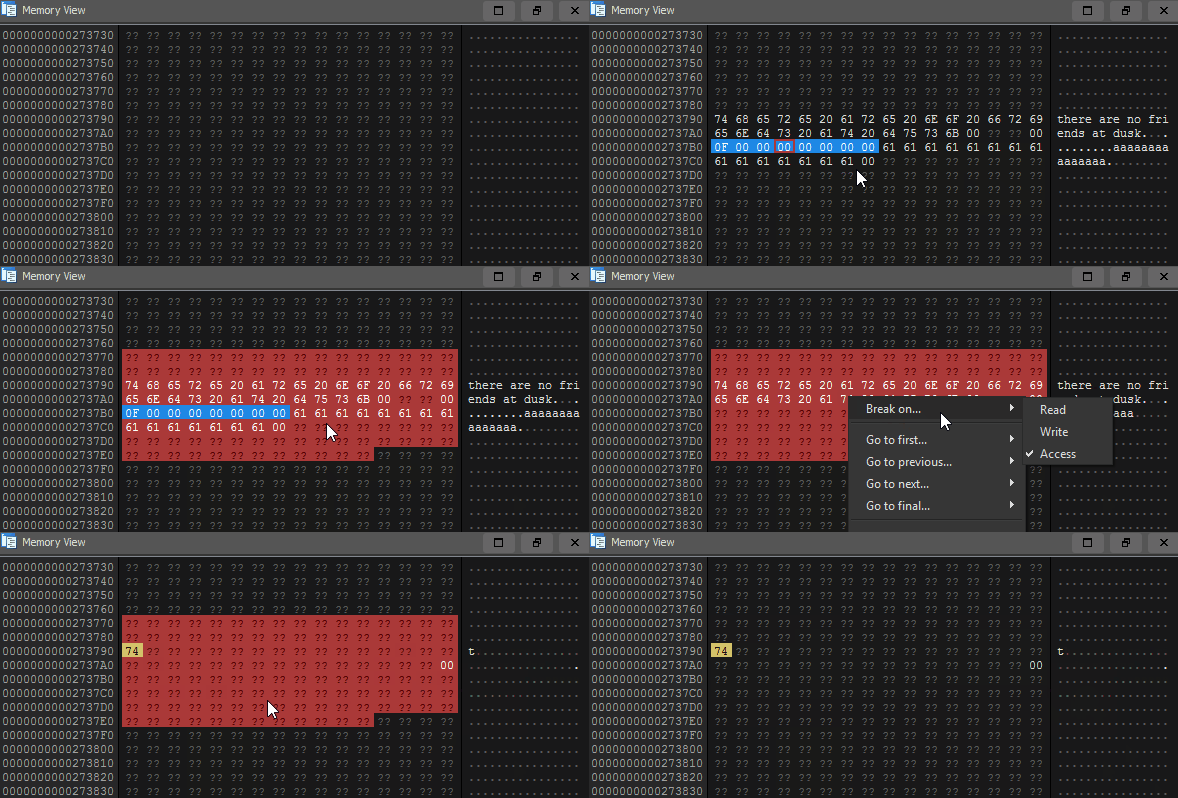
In the v0.1 release, Tenet was simply too chaotic and unforgiving in its manner of placing/removing breakpoints. You now must double click to place a memory breakpoint, or execution breakpoint.
As breakpoints are now placed much more explicitly, you can have both an execution and memory breakpoint active at the same time. To remove breakpoints, you can double click empty area in the memory or register windows.
Breakpoints can now have their access type set via right click, same with region breakpoints.
In the future, there will hopefully be a dedicated widget to manage and configure multiple breakpoints.
what the fuzz + Tenet
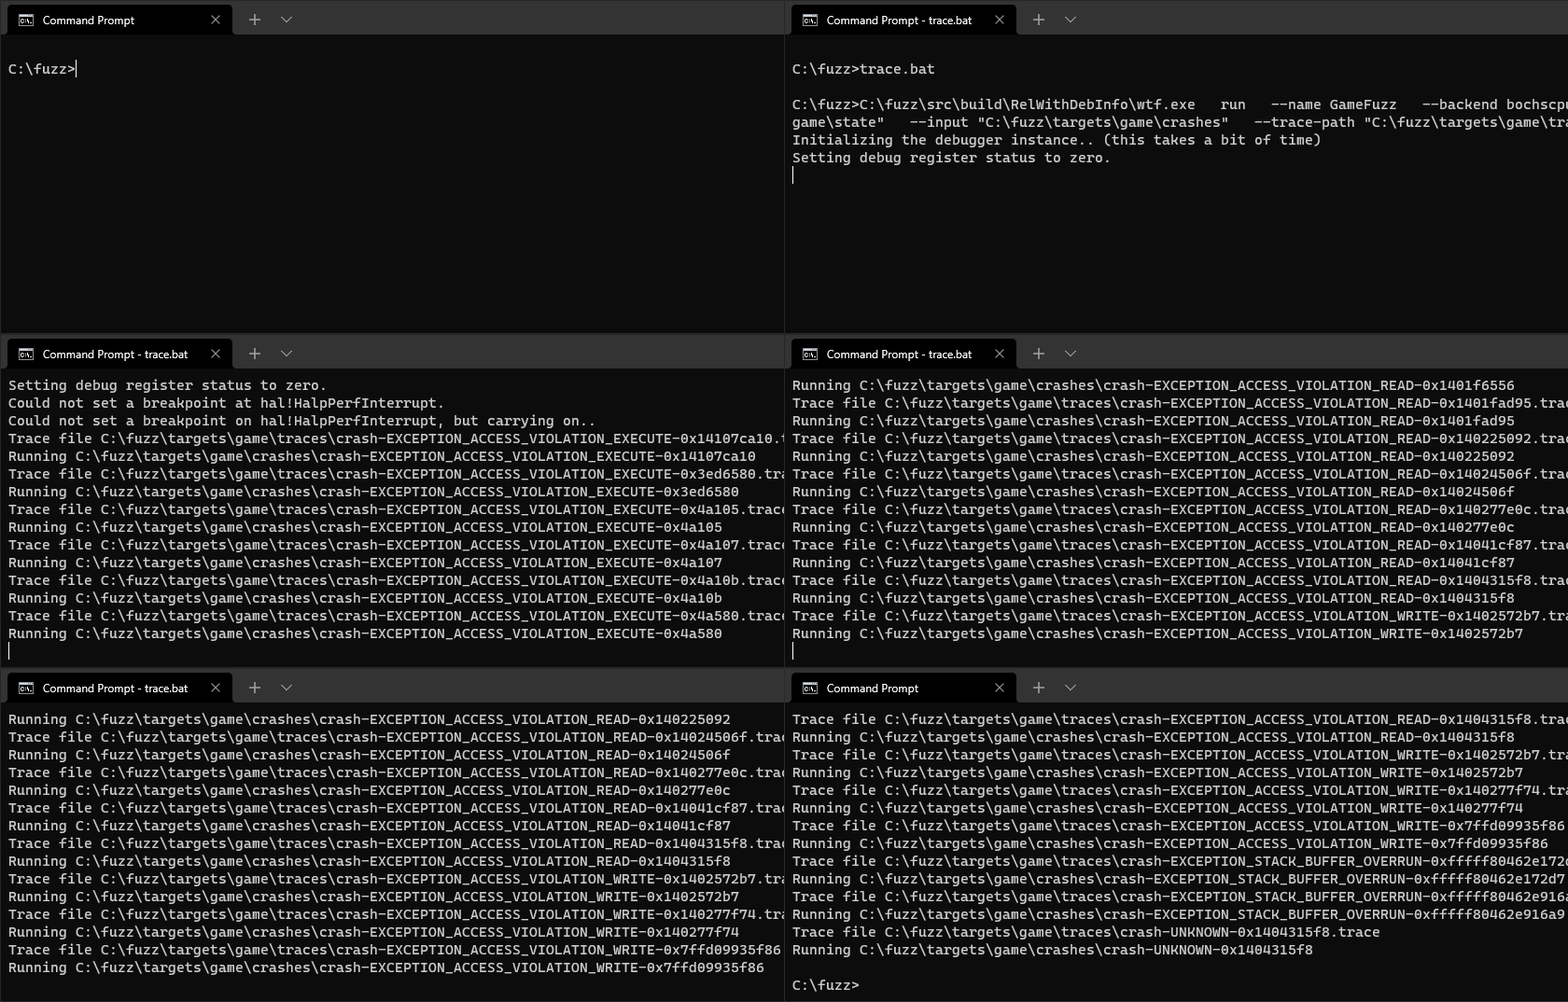
In a previous post, we demonstrated one of the best real-world use cases for Tenet today: performing root-cause-analysis on crashes produced by snapshot-based fuzzers! Since our post, Axel (@0vercl0k) was kind enough to clean up and merge our pull request which enables what the fuzz to generate Tenet traces.
It looks like there’s already a few brave souls trying to put this bleeding edge combo to work.
!last Command
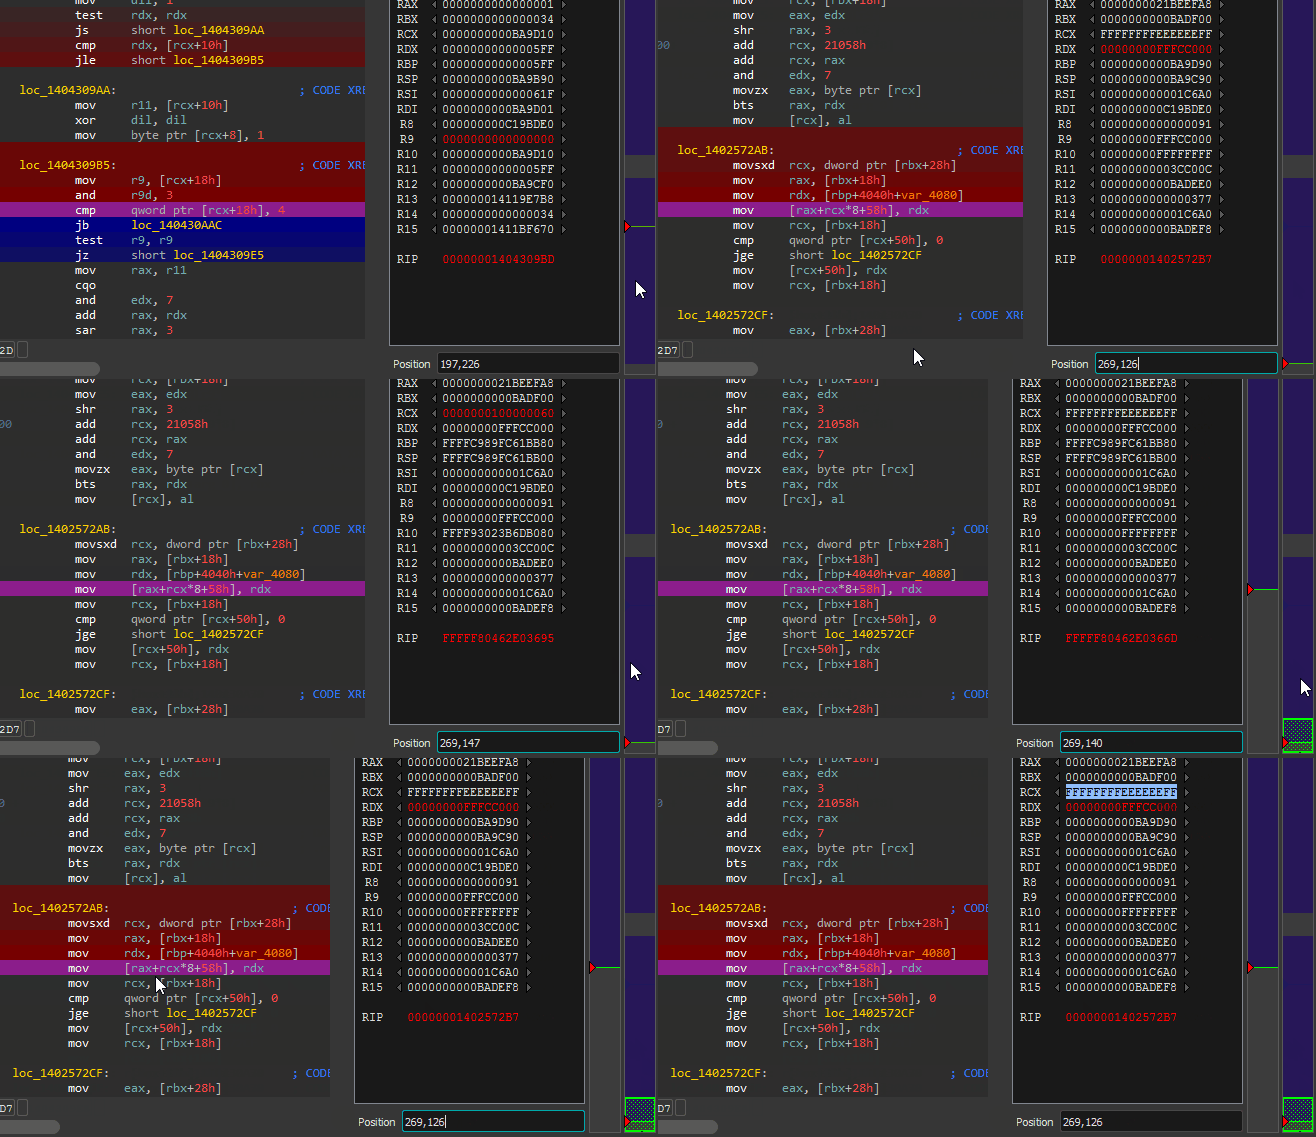
Oftentimes, the last navigable instruction may not be at the absolute end of your trace. For this reason, it made sense to add the !last command to the ‘timestamp shell’ that would jump Tenet to this point of interest.
Tracing a user mode crash in what the fuzz shows one case where this command demonstrates utility, taking us to the moment the user mode program ‘crashes’, just before the trace continues into the kernel mode fault handler.
Other Changes
While this post has covered the most notable updates for this release of Tenet, please click here to see more details and the complete changelog on GitHub.
Conclusion
Tenet is a work in progress. It is meant to place new ideas in the context of real-world problems to evaluate their efficacy. As it continues to mature, we hope that it will change the way we perceive software and study execution.
Our experience developing for these technologies is second to none. RET2 is happy to consult in these spaces, providing plugin development services, the addition of custom features to existing works, or other unique opportunities with regard to security tooling. If your organization has a need for this expertise, please feel free to reach out.

