Timeless Debugging of Complex Software
Root Cause Analysis of a Non-Deterministic JavaScriptCore Bug
In software security, root cause analysis (RCA) is the process used to “remove the mystery” from irregular software execution and measure the security impact of such asymmetries. This process will often involve some form of user controlled input (a Proof-of-Concept) that causes a target application to crash or misbehave otherwise.
This post documents the process of performing root cause analysis against a non-deterministic bug we discovered while fuzzing JavaScriptCore for Pwn2Own 2018. Utilizing advanced record-replay debugging technology from Mozilla, we will identify the underlying bug and use our understanding of the issue to speculate on its exploitability.
Using Mozilla's rr, one can place a memory breakpoint, and run an execution trace backwards
For a top-level discussion of this blog series and our entire Pwn2Own 2018 exploit-chain, check out part one.
Initial Analysis
As a refresher of where we left off in the previous post, our JS fuzzer produced an interesting crashing testcase against WebKit’s JavaScriptCore. We trimmed the problematic testscase down to a minimized poc.js which still demonstrated some unexpected behavior from JSC:
// initialize a JSArray (someArray1), with more JSArrays []
var someArray1 = Array(20009);
for (var i = 0; i < someArray1.length; i++) {
    someArray1[i] = [];
}

// ???
for(var index = 0; index < 3; index++) {
    someArray1.map(
        async function(cval, c_index, c_array) {
            c_array.reverse();
        });
}

// print array contents & debug info
for (var i = 0; i < someArray1.length; i++) {
    print(i);
    print(someArray1[i].toString());
}
print(describeArray(someArray1))
The abnormal behavior we observed was that sometimes JSPromise objects would appear scattered randomly throughout someArray1. Yet nowhere in poc.js do we store promise objects into someArray1. We expect there to be only be JSArray objects in someArray1 at the end.
Testing the minimized PoC against a debug build of JSC
This issue reproduced non-deterministically, hinting that our bug could be a race condition. Based on poc.js, our initial thoughts are that perhaps JSC’s implementation of JavaScript’s async function decorator might have some data safety issues, but it is hard to make any concrete assertions this early.
Citing existing resources, we learned of the countless debug flags available in JSC. In an effort to ‘reduce scope’ of the RCA process, we used one of these debug flags to disable JSC’s JIT by setting the following environment variable:
JSC_useJIT=false
Running poc.js under JSC with this toggle set, we notice that execution is notably slower but the issue would still reproduce. We have learned that this is not a JIT based bug, eliminating a significant portion of JavaScriptCore’s codebase and complexity from our root cause consideration.
The remaining non-determinism, paired with our unfamiliarity of the codebase, made traditional debugging impractical for building an understanding of this issue. We must employ more advanced techniques to analyze this defect.
Record-Replay Debugging
Over the past several decades, the core experience of prominent C/C++ debuggers has been frozen in time (on all platforms). Only in recent years have we begun to see some of these technologies revisited and innovated upon in a truly novel manner.
In particular, the general availability of robust, timeless debugging is a game changer for the industry. Projects such as Mozilla’s rr, Microsoft’s TTD, MIT Lincoln Lab’s PANDA, and even GeoHot’s QIRA have laid the foundation to enable new and weird ways for us to explore or automate many of today’s complex debugging tasks.
Thus far, the adoption and application of these technologies by the broader security & development communities has been negligible compared against their possible utility. It is hard to speculate on all the ways these technologies will come to change the way we use debuggers, or experience application runtimes in the years to follow.
Hubble, an experimental debugger frontend by RET2 for navigating rr & TTD runtime traces
In the context of this post, we only go so far as to demonstrate the standard usage of Mozilla’s rr as an extension of gdb. We hope to discuss some of the more exploratory research and tools we’ve built on top of these timeless debugging frameworks in the future. The innovation in these spaces is nothing but exciting, if not alien.
Recording the Vulnerability
Returning back to earth, let’s begin analyzing the strange behavior produced by our minimized testcase using some of the timeless debugging technology introduced in the previous section. We will use Mozilla’s rr to record the JSC process as it executes our poc.js on a 64bit Ubuntu 16.04 VM.
Tracing JSC with rr can be done with one command:
JSC_useJIT=false LD_LIBRARY_PATH=/home/doom/WebKitRCA/jsc-debug/lib rr record -h /home/doom/WebKitRCA/jsc-debug/bin/jsc bugs/poc.js
Since rr is so good at capturing traces in a deterministic fashion, we actually have to make use of ‘chaos’ mode (the -h flag) to get poc.js to reproduce the errant JSC behavior while being traced.
In chaos mode, rr will purposely throw wrenches into thread scheduling while recording a process in an effort to force different execution patterns across multiple runs. This mode was designed explicitly to help with reproducing non-deterministic bugs (such as ours) under rr. Bravo, Robert!
Capturing a trace of the PoC using Mozilla's record-replay framework
The trace that rr produces is a 100% reproducible runtime trace that can be used directly in gdb. The beauty of tracing technology is that we will never have to re-launch JSC or touch our PoC again. The trace provides perfect information of the captured process runtime and can be navigated timelessly in a debugger.
Replaying the Vulnerability (Trace)
Debugging a captured trace is as simple as passing the trace to rr replay:
rr replay /home/doom/.local/share/rr/jsc-0
This drops us into an augmented version of gdb, where we now have a few reverse-* debugging commands (among others) available for use:
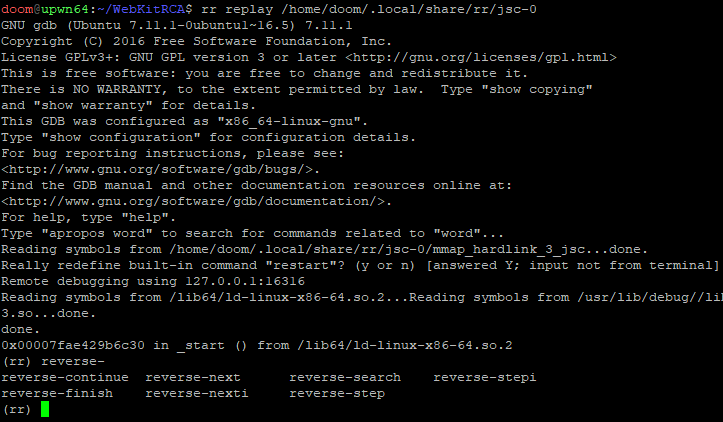
rr extends standard gdb, adding a number of new commands for bidirectional debugging
Typing continue into the rr enlightened gdb prompt, we can watch as the captured trace runs start to finish as it was previously recorded outside the debugger:
Replaying the captured trace via rr replay (gdb)
At the end of the trace, we see the debug print from the describeArray(...) call we placed at the end of our poc.js. This print tells us where the backing store (the butterfly) for our misbehaving JSArray is in memory.
Dumping memory at the butterfly, we can see gobs of pointers:
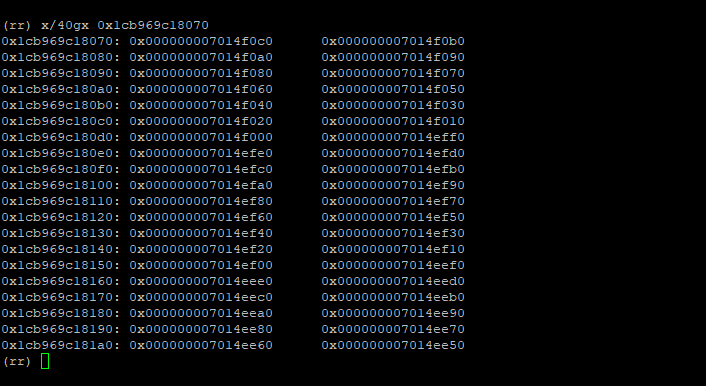
Dumping the JSArray butterfly reveals pointers to more JS cells
This is to be expected. These are pointers to all the JS cells (objects, effectively) stored in the JSArray. What we want to figure out is how pointers to JSPromise cells got into this array butterfly.
Let’s follow just one of the first pointers in the butterfly. Specifically, dumping some data around address 0x7014f0c0 (the very first entry in the butterfly), we can see an interleaving of two different types of JS cells on the heap:
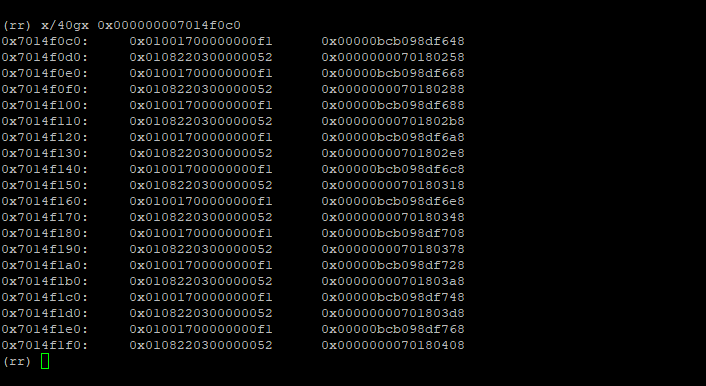
Swaths of JSArray & JSPromise cells interleaved on the heap
This aligns with what we have observed in the scrolling runtime prints produced by our testcase. The first few thousand entries of our array alternate between JSPromise objects, and JSArray objects… but nowhere in poc.js do we explicitly store promises.
From an investigative standpoint, it is still difficult to reason about the true nature of the bug we are dealing with.
The Life, Death, and Rebirth of 0x7014f0c0
The mystery begins to unravel if we follow the lifetime of one of these JSPromise cells. Specifically, we will use rr to run backwards, discovering when and where the JSPromise located at 0x7014f0c0 actually came into being:
Using Mozilla's rr, one can place a memory breakpoint and run an execution trace backwards
By placing a memory watchpoint and executing in reverse, we can see exactly when the memory at 0x7014f0c0 (a promise cell) was last written to. The memory breakpoint trips at the following callstack:
The callstack for the most recent write to a JSPromise found in our errant array
The callstack above seems to indicate that the last write to this Promise cell was during its creation. But what was this memory used for prior to becoming a Promise object?
To find out, we continue executing backwards through a few more writes to the following callstack:
These are not the kind of callstacks you want to be looking at when chasing exploitable bugs
At the very top of the callstack, we can see that we are within JSC::Scribble(...). Scribbling is a general technique used in debug builds of software to overwrite freed data with known pattern bytes. This makes it very clear to a developer whether heap data they are looking at is in a freed state.
'freed' heap allocations being scribbled over with 0xbadbeef0
At our current callstack, it’s clear that 0x7014f0c0 is most definitely considered ‘free’. In fact, it appears that this whole block of heap data is being scribbled over as indicated by all the 0xbadbeef0 values.
Let’s keep going further back. We still do not know what this memory was used for before it was freed. With the same memory breakpoint still set, we continue executing backwards one more time to reveal this final callstack:
Prior to being 'freed', 0x7014f0c0 was being used as a JSArray cell
This callstack tells us that the pointer that we have been following backwards was originally allocated as a JSArray. This allocation was made towards the start of our testcase. Presumably, this is one of the 20,000+ JSArray objects we explicitly created and stored into the problematic someArray1:
var someArray1 = Array(20009);    // create JSArray of size 20009
for (var i = 0; i < someArray1.length; i++) {
    someArray1[i] = [];           // create and store an empty JSArray
}
...
At this point, we have determined that at least some of the JSArray objects we create and store into someArray1 at the beginning of the testcase are mistakenly being freed during execution.
We can also attribute the creation of (60,000+) JSPromise allocations to the fact that we are calling an async function three times, for each of the 20,000+ items in someArray1:
...
for (var index = 0; index < 3; index++) {
    someArray1.map(
        async function(cval, c_index, c_array) {
            c_array.reverse();
        });
}
...
A number of the JSPromise cells that our testcase spews just happen to get allocated over the mistakenly freed JSArray cells. Blissfully unaware, some pointers in the butterfly now point to the newly allocated promises. This explains how JSPromise objects seem to magically appear throughout someArray1.
What we still don’t understand is why JSC thinks that some of the original JSArray objects we store into someArray1 should be okay to free. This is not an easy question to answer: it requires us to debug JSC’s new, concurrent garbage collector called Riptide.
An Autopsy of 0x7014f0c0
We need to understand the garbage collector’s reasoning for believing 0x7014f0c0 is free(able). The best place to begin our journey (backwards) into the depths of the garbage collector (gc) is from the scribbling death of 0x7014f0c0 as highlighted in the previous section.
Closer inspection of the callstack at the time of death shows that approximately 16K of data was being scribbled over:
#0  0x00003b485a1319d3 in JSC::scribble (base=0x7014c0a0, size=16224)
#1  0x00003b485a13f666 in JSC::MarkedBlock::Handle::specializedSweep...
...
Reading about Riptide, the developers state that:
[Heap] Memory is divided into 16KB blocks. Each block contains cells. All cells in a block have the
same cell size, called the block’s size class.
This description gives us some idea to the structure of the heap, and what exactly a MarkedBlock is.
With regard to ‘Sweeping’ (eg, freeing), the the Riptide article states:
Sweeping is incremental in the sense that we only sweep a block just before allocating in it.
...
A per-block bit tells the sweeper if the block is completely empty. If it is, the sweeper will set
up a bump-pointer arena over the whole block rather than constructing a free-list.
This mirrors exactly what we see in the current callstack.
While attempting to allocate new memory for a JSPromise cell [1], a candidate heap block is selected [2], and swept [3]. Incorrectly, this ‘per-block bit’ must be getting set somewhere, indicating that the whole block is free [4] when it is actually still in use.
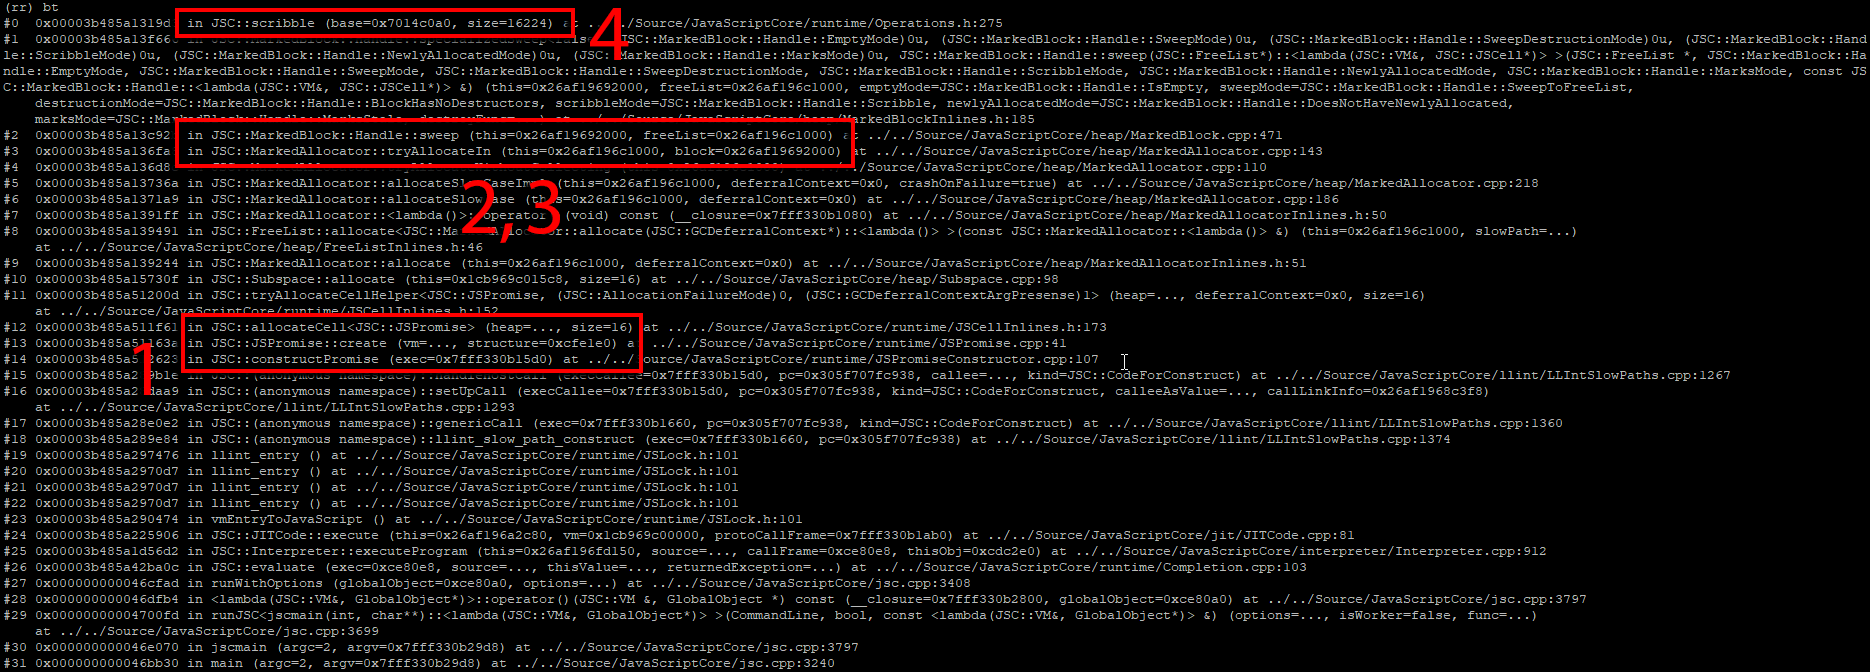
The callstack for the creation of a JSPromise object that ended up in someArray1
Stepping backwards up through the callstack a bit, we can see that the block’s owner (a heap allocator) seems to hold the ‘empty’ block status bit(s) which can be accessed through a call to m_allocator->isEmpty(...):
A heap block's 'empty' bit is actually held by its parent allocator
Digging through the generated macro of isEmpty(...), we find a bit vector (m_empty) responsible for tracking which blocks managed by the allocator are considered ‘empty’. An empty block is one that has no allocations considered in-use. In this case, our block’s empty status is represented by index 19 (eg, the 19th bit) into m_empty.
Using the debugger, we can print the bit level representation of the bit vector backing memory that our block (19th bit) falls within. We also can also print the boolean representation of whether our bit is set or not, indicating whether the block is considered ‘isEmpty’:
Printing the DWORD our isEmpty bit falls within, and then printing the boolean status of our explicit bit
The introspection confirms everything we know so far. The empty bit is indeed set for our block, so the gc believes the MarkedBlock that 0x7014f0c0 falls within is empty. But who dare set this bit?
Placing a memory breakpoint on this bit vector (m_empty), we continue executing backwards through various bit flips (writes to the bit vector) until stopping at the origin of the 19th bit:
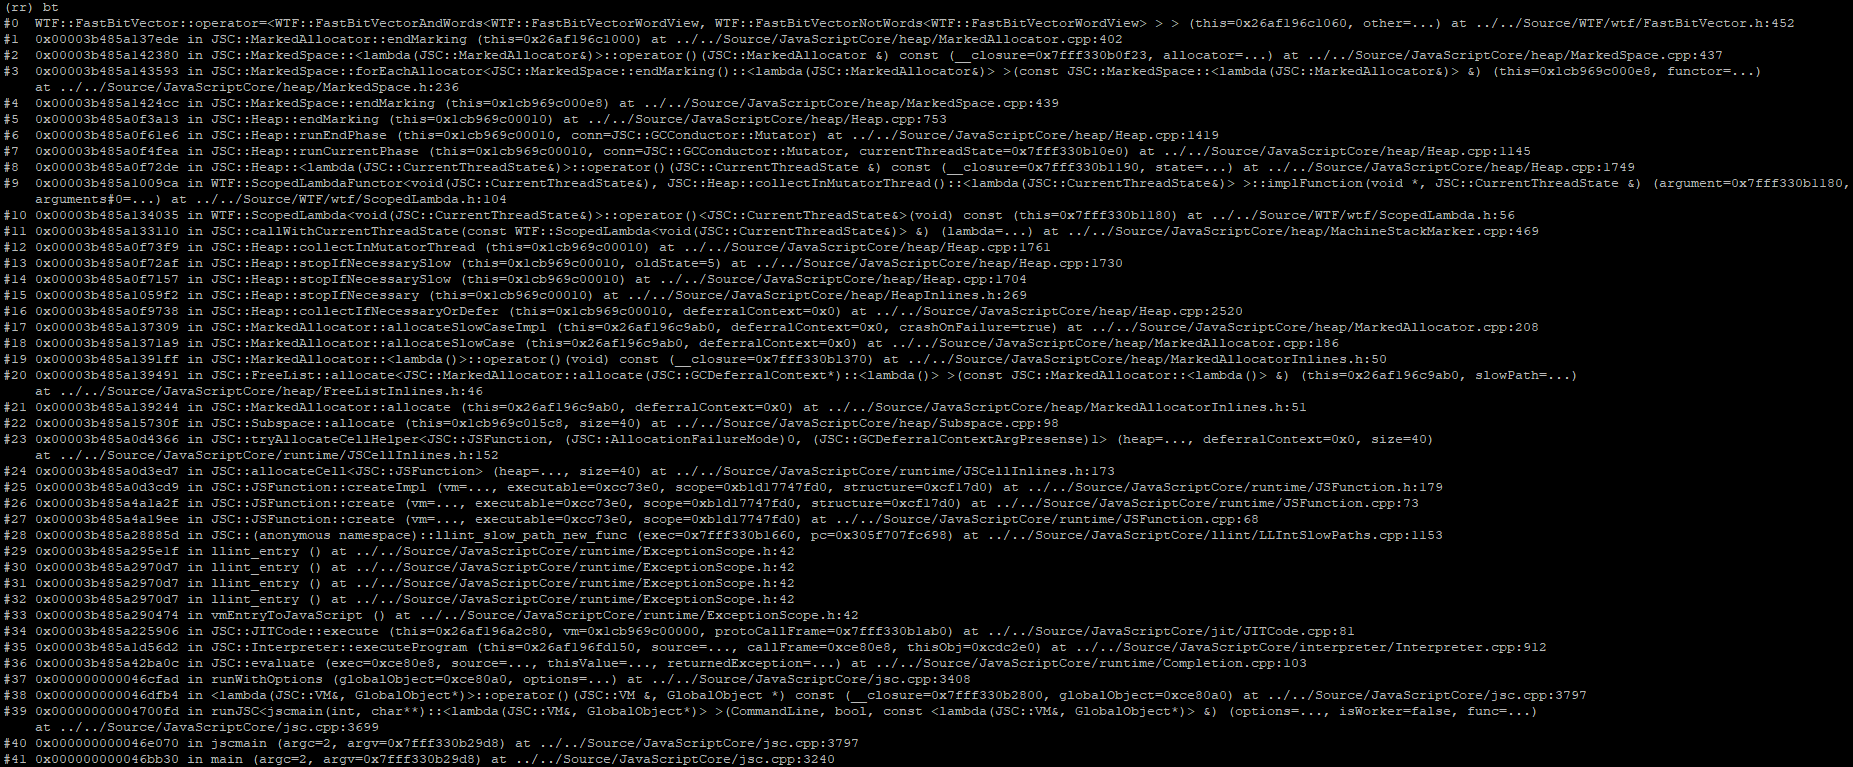
The garbage collector is lovely, dark and deep ...
Our block’s bit was set within the m_empty bit vector from an assignment at the end of a marking phase. Specifically, m_empty gets its original set of bits by combining the bit vectors for m_live and m_markingNotEmpty:
Dumping the 19th bit (our block) of the respective bit vectors
We expect our heap block to be alive, so m_live[19] being true makes sense. But m_markingNotEmpty[19] is set to false, meaning that not a single JS cell in our block was observed by the marking thread. This does not seem right.
Setting a write watchpoint on the m_markingNotEmpty bit vector and running backwards, we are stopped multiple times by the marking thread setting bits to indicate heap blocks as ‘not empty’ (eg, in use):
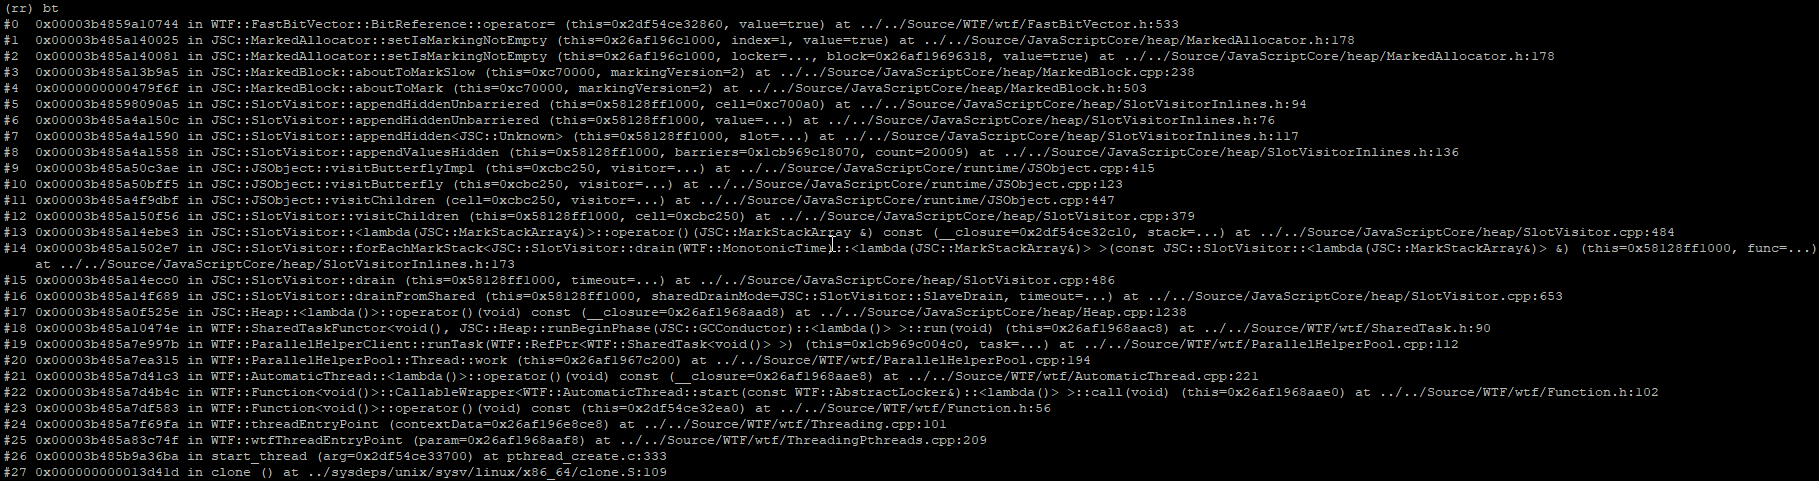
The marking thread continually walks JS cells on the heap (as in-use) to determine what memory can be reclaimed
The callstack above depicts the marking thread walking a butterfly of length 20,009, implying it is most certainly marking the contents of our problematic someArray1. Things get really interesting when we place a watchpoint on the butterfly index containing 0x7014f0c0 (because it never gets marked) and continue running…
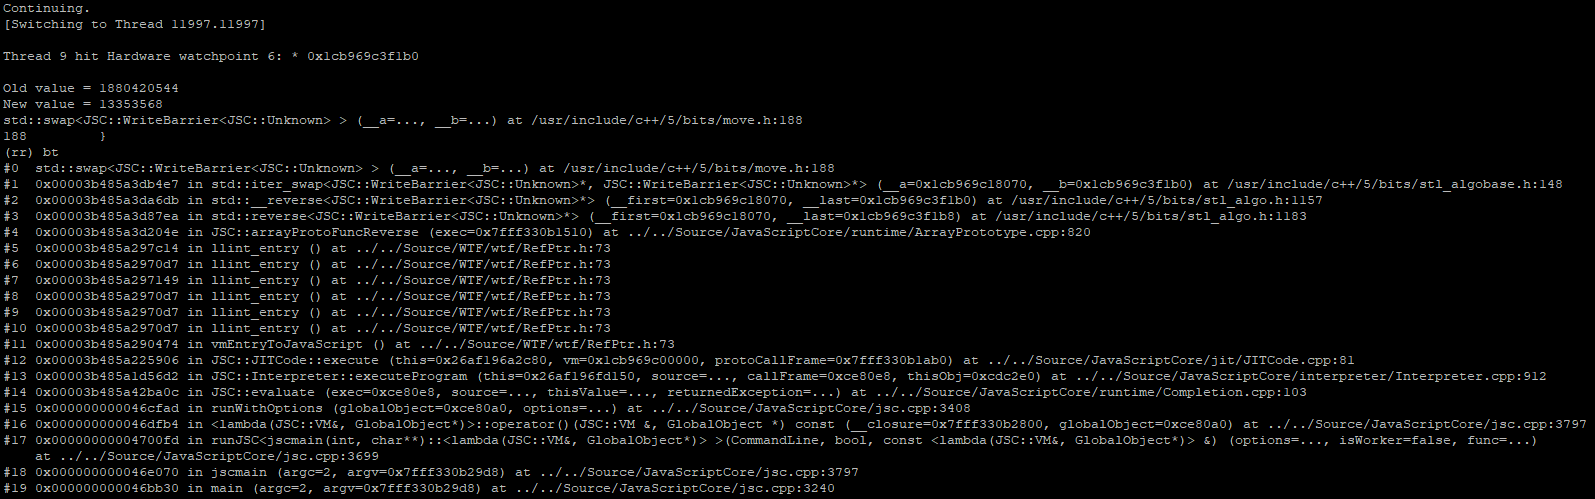
Hitting a watchpoint from std::reverse(...) running in the main thread, while marking is occurring
The new memory watchpoint triggers immediately, and we flip from the gc’s marking thread to JSC’s main thread which is in the middle of calling std::reverse(...) on the butterfly while it is being marked. This can’t be good.
We have identified the root cause of the vulnerability: the butterfly for someArray1 is being reversed (eg, modified) by the main interpreter thread, simultaneous to the marking thread walking the butterfly contents.
Array.reverse() Considered Harmful
The new JSC garbage collector employs up to 8 thread(s) dedicated to walking and marking JS cells (objects) on the heap as part of its mark-and-sweep implementation. When a JS cell is ‘marked’ by the garbage collector, it means that the object is still ‘in-use’. Objects or blocks that have not been marked are prone to get ‘swept’ (freed) as necessary.
The vulnerability is a data hazard (race condition) between the marking thread, and array.reverse():
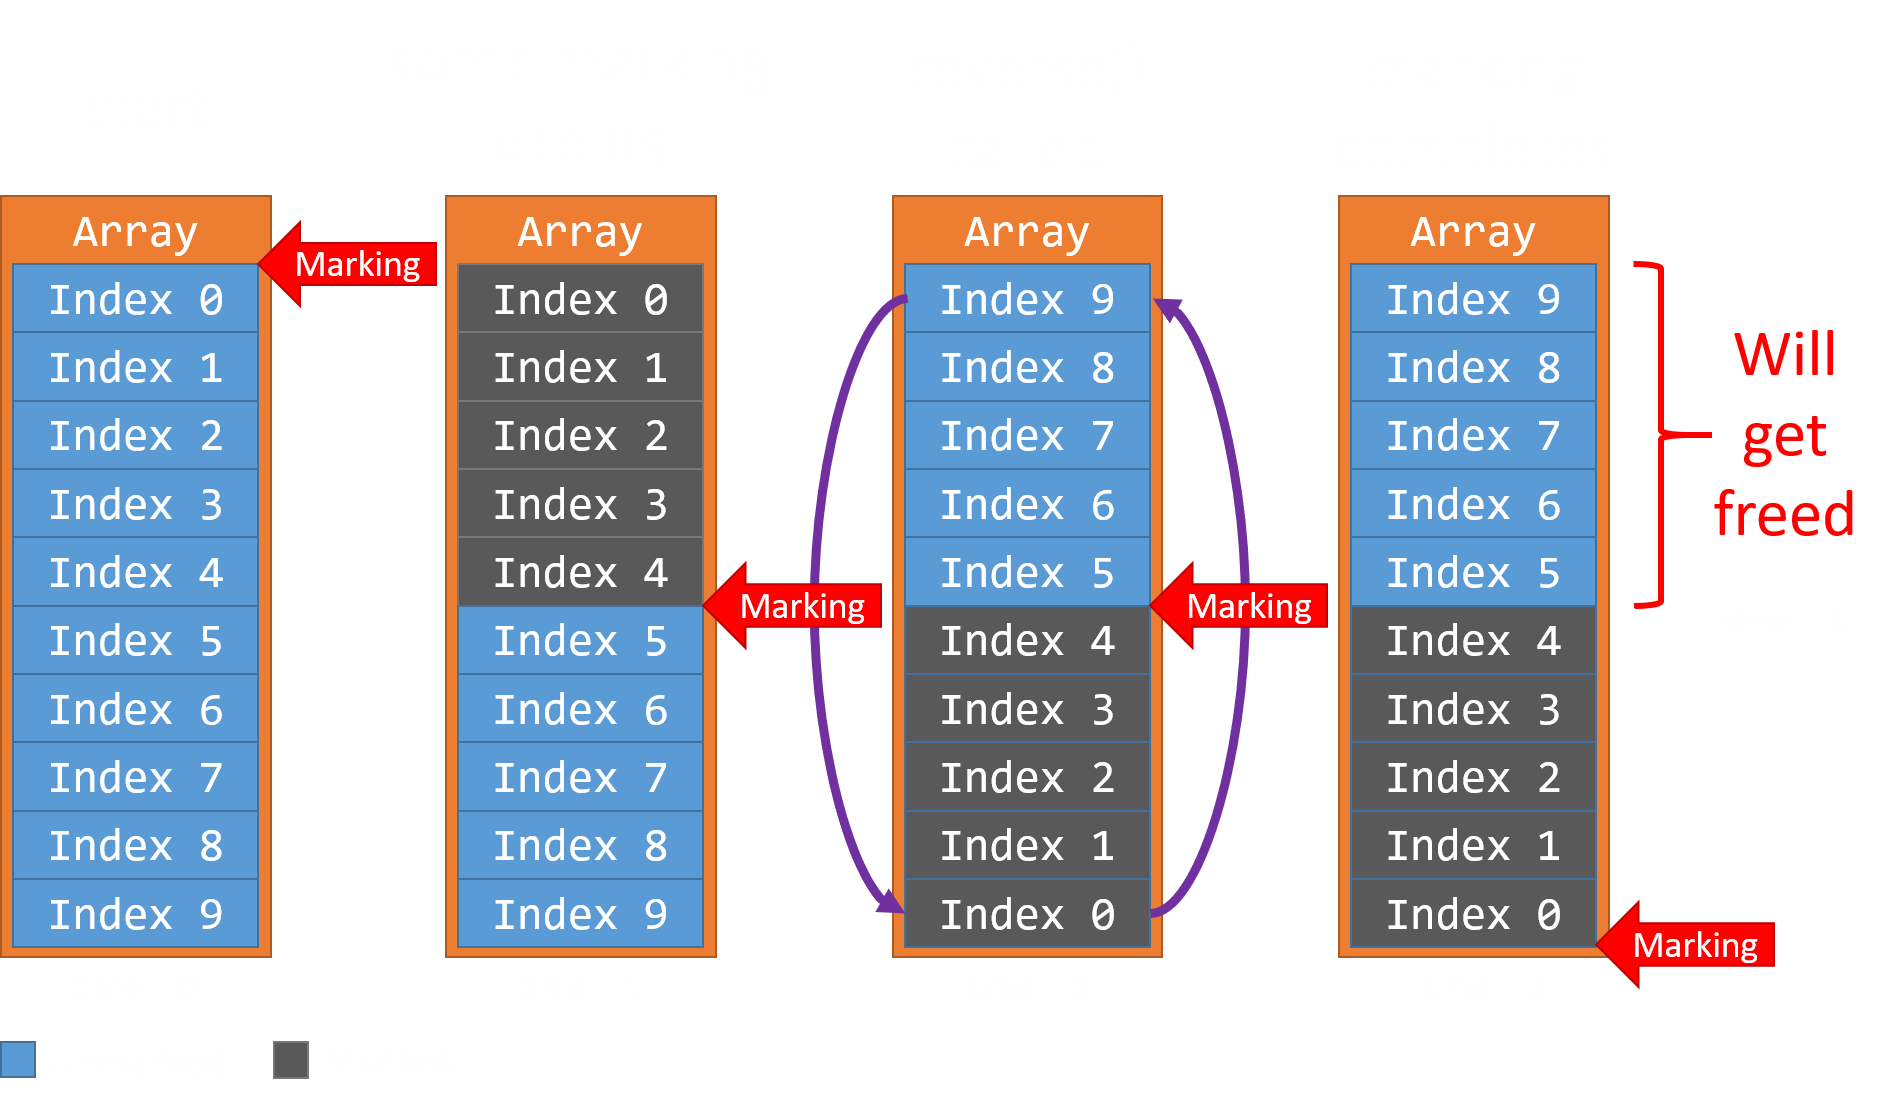
A diagram depicting the data race between marking, and array reversal
While an asynchronous marking thread is walking the butterfly of a JSArray, array.reverse() can be called from JSC’s main interpreter thread. If timed correctly, some portion of the array’s contents may elude the marking thread’s traversal, making these objects eligible to get freed during the next sweep.
This vulnerability is particularly powerful: an attacker can prematurely free any type of JS object in JSC by simply storing it in a JSArray, and calling array.reverse(). Forcing a Use-After-Free scenario such as this is almost universally considered a critical security issue.
We exploited this vulnerability as a zero-day at Pwn2Own 2018 to achieve Remote Code Execution (RCE) in the context of the Safari Web Browser. The issue has since been fixed by Apple as CVE-2018-4192.
Vulnerability Origin
This bug was introduced to JavaScriptCore in early 2017 as a direct result of the arrival of Riptide. The vulnerability began shipping globally in Safari starting with the release of MacOS High Sierra (10.13) in September 2017.
Transitioning JavaScriptCore to a concurrent garbage collector broke many assumptions made in the original codebase. The code for array.reverse() was correct when it was first written, but another dimension was added to its reality (by Riptide) which ultimately compromised its security posture.
At the complexity and scale of browsers, it feels unfair to point fingers and blame any one developer for introducing an issue like this. Without an intimate understanding of the new garbage collector and its phantasmal manner of operation, no developer or security researcher would be likely to have enough context to identify this bug through code review.
Practically speaking, this vulnerability (well, regression) should have been caught by something like OSS-fuzz as part of the WebKit software development lifecycle.
Conclusion
Root cause analysis is a test of understanding for attackers and defenders alike. For some bugs, it can take mere minutes to identify the issue and assess its security impact. Other times, it can take multiple days of creative debugging to gather enough context of the bug and afflicted codebase to fix (or exploit!) an issue.
Our fourth installment of this series will break down the process of weaponizing the JavaScriptCore vulnerability that we documented in this post. We will present an improved PoC, and walk through the process of building it up to arbitrary code execution in Safari.