Tenet: A Trace Explorer for Reverse Engineers
Conventional Debuggers Are Crumbling to Software Complexity, Now What?
Debugging is traditionally a tedious, monotonous endeavor. While some people love the archaeological process of using a debugger to uncover software defects or perform tasks in software reverse engineering, virtually everyone agrees that the tools have started to show their age against modern software.
Our methods of runtime introspection are still hyper-focused on individual states of execution. This is a problem because software has grown dramatically more complex, requiring more context and ‘situational awareness’ to properly interpret. The emergence of timeless debugging has alleviated some of these growing pains, but these solutions are still built around conventional methods of inspecting individual states rather than how they relate to one another.
I am open sourcing Tenet, an IDA Pro plugin for exploring execution traces. The goal of this plugin is to provide more natural, human controls for navigating execution traces against a given binary. The basis of this work stems from the desire to research new or innovative methods to examine and distill complex execution patterns in software.
Background
Tenet is directly inspired by QIRA. The earliest prototypes I wrote for this date back to 2015 when I was working as a software security engineer at Microsoft. These prototypes were built on top of the private ‘trace reader’ APIs for TTD, previously known as TTT, or iDNA.
I abandoned that work because I wasn’t convinced an assembly level trace explorer would make sense at the one company in the world where Windows is called ‘open source software’.
I’m revisiting the idea of a trace explorer because it’s 2021 and the space is still wildly undeveloped. Among other ideas, I firmly believe in the notion that there is a geographical landscape to program execution, and that the principles of traditional cartography can be applied to the summarization, illustration, and navigation of these landscapes.
As cool as I hope you find the plugin, Tenet is only a stepping stone to further research these ideas.
Usage
Tenet can be downloaded or cloned from GitHub. It requires IDA 7.5 and Python 3.
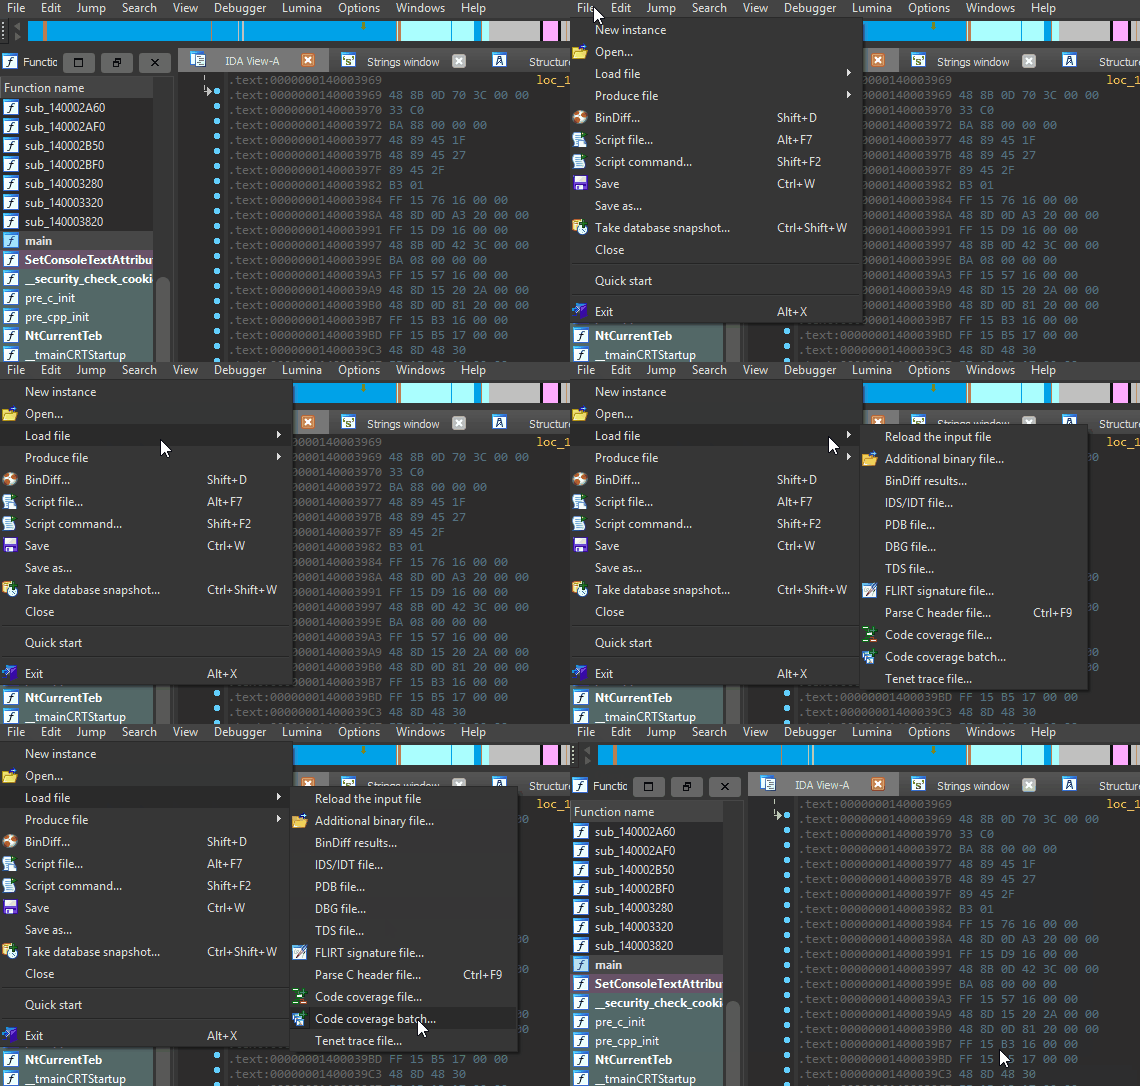
Once properly installed, there will be a new menu entry available in the disassembler. This can be used to load externally-collected execution traces into Tenet.
As this is the initial release, Tenet only accepts simple human-readable text traces. Please refer to the tracing readme for additional information on the trace format, limitations, and reference tracers.
Bidirectional Exploration
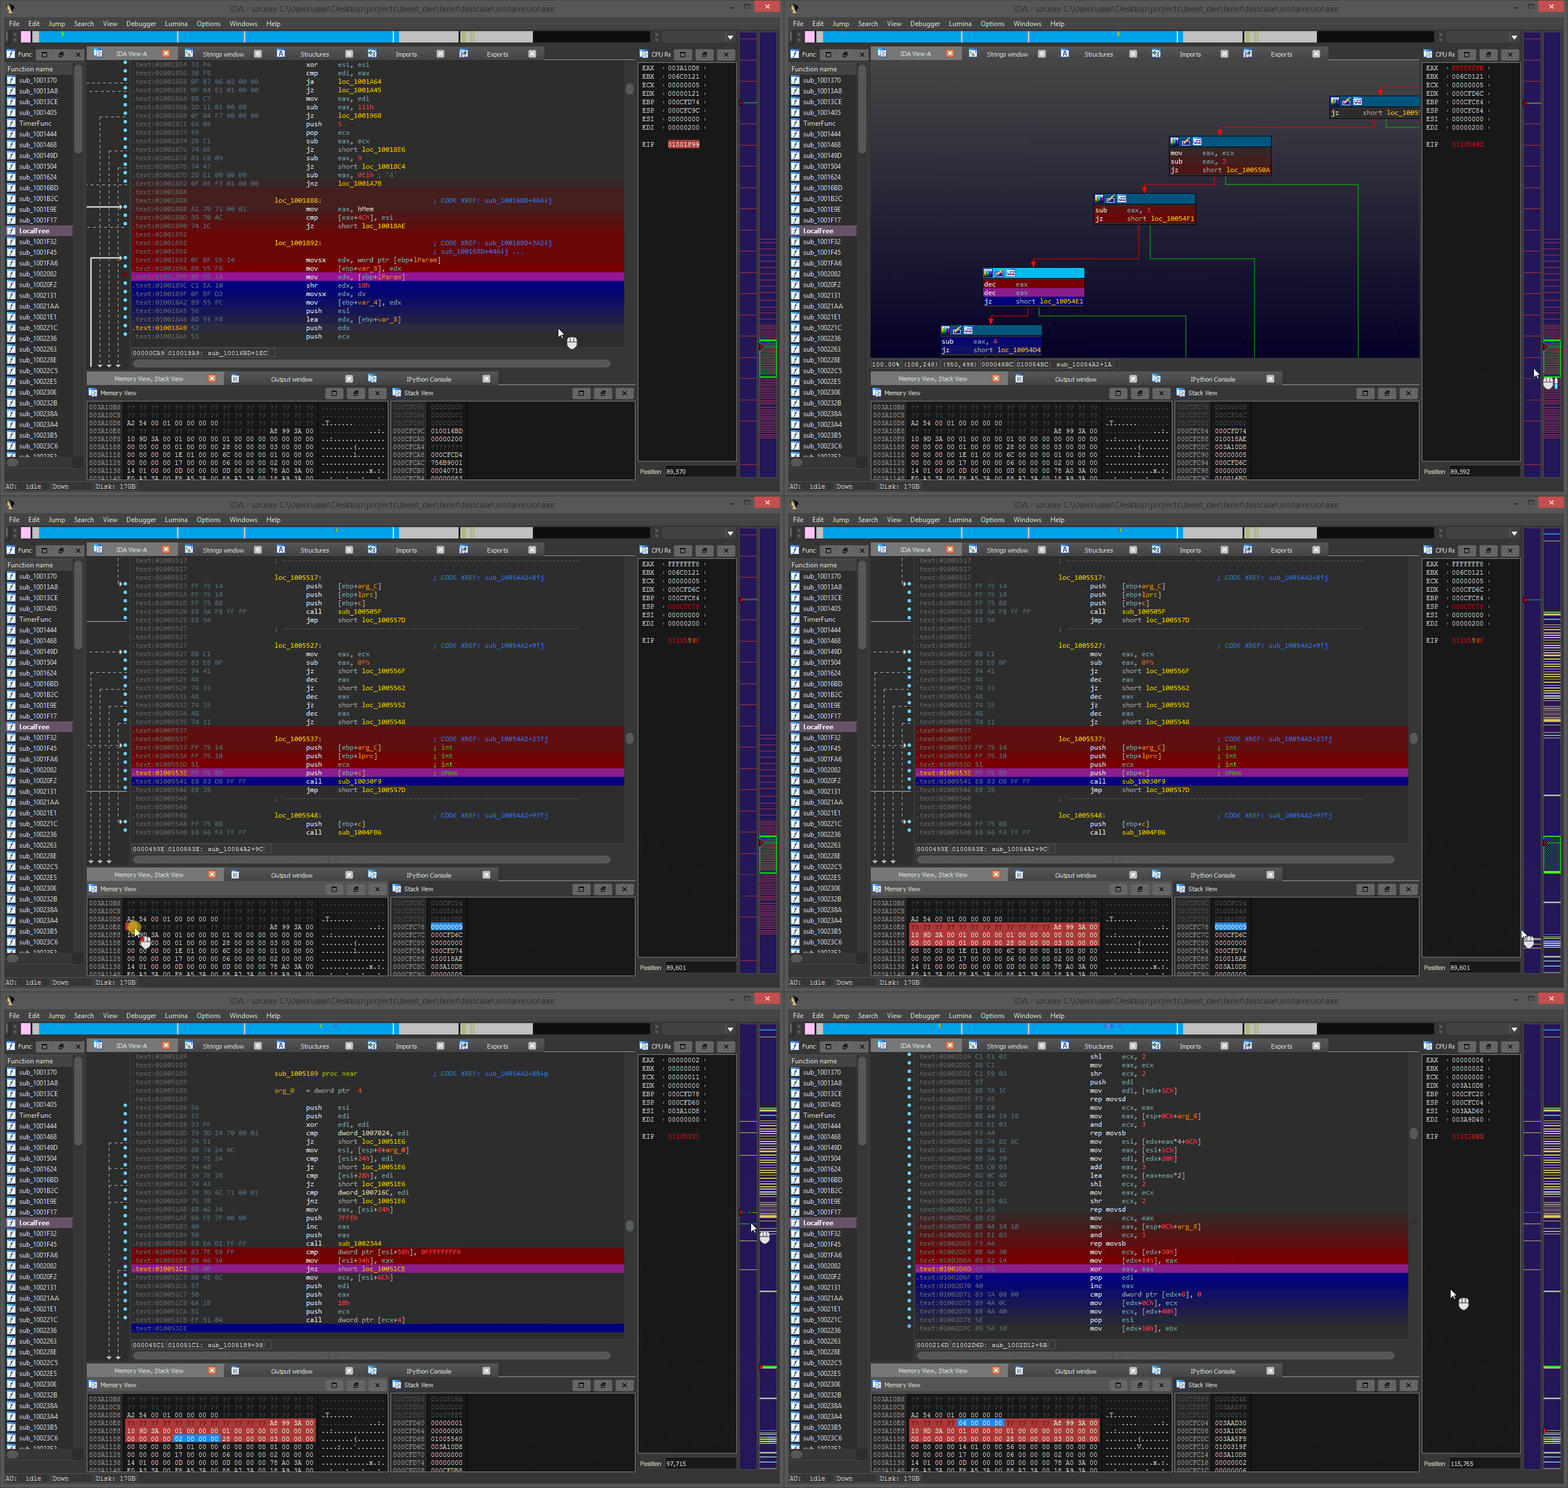
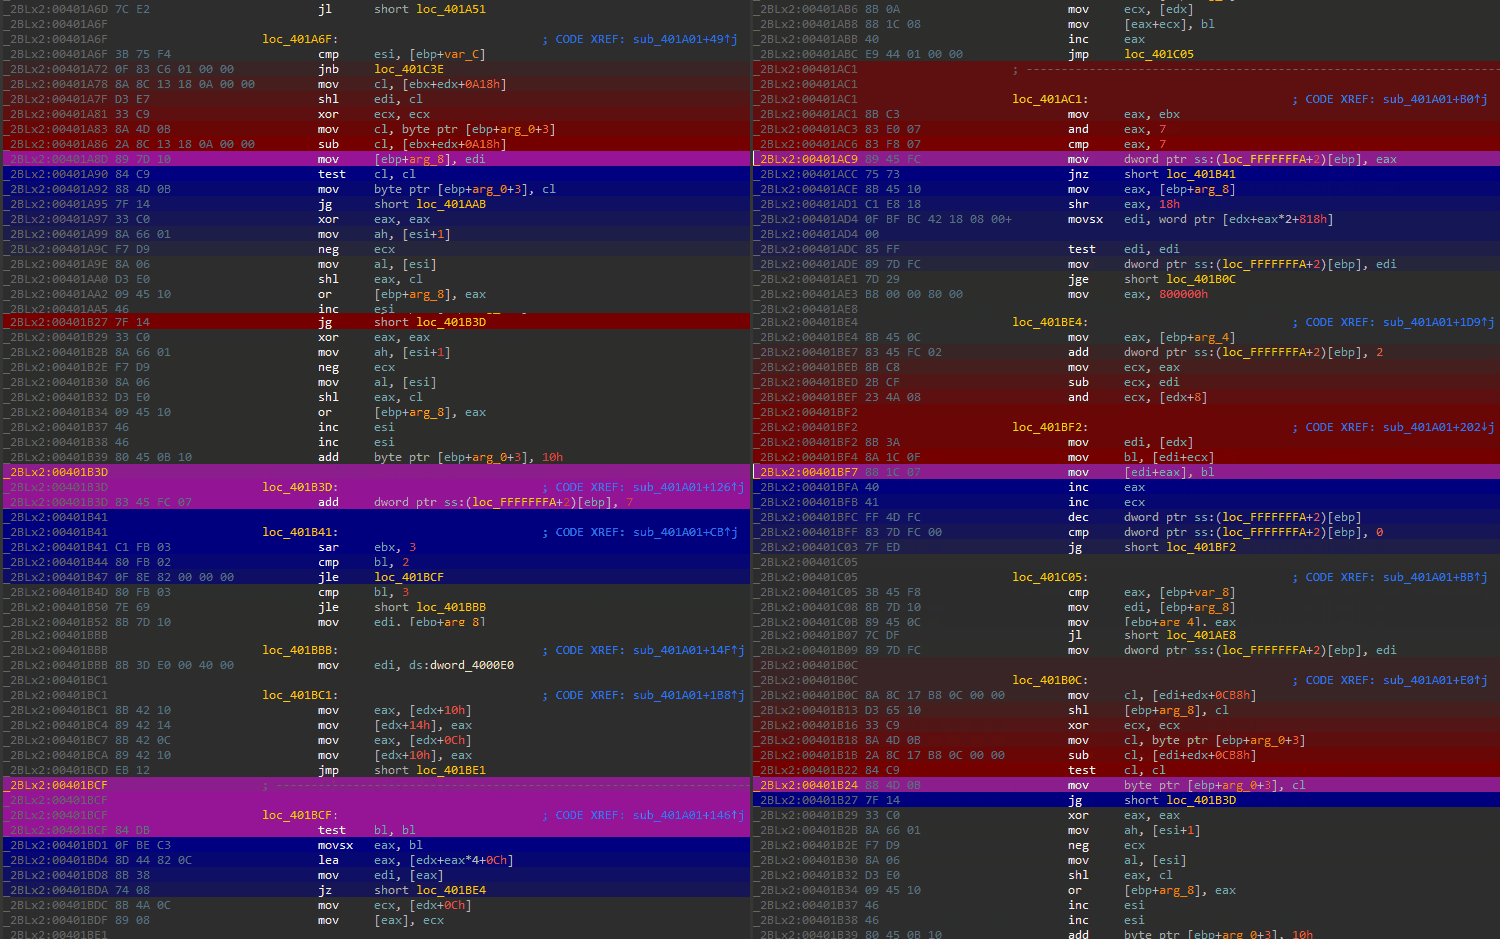
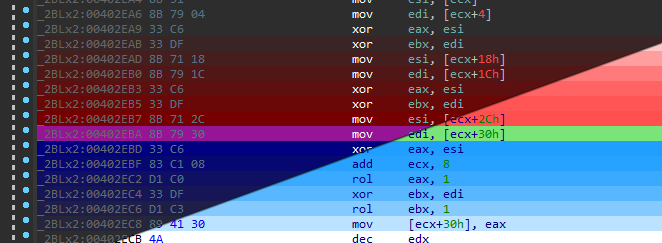
While using Tenet, the plugin will ‘paint’ trails to indicate the flow of execution forwards (blue) and backwards (red) from your present position in the active execution trace.
To step forwards or backwards through time, you simply scroll while hovering over the timeline on the right side of the disassembler. To step over function calls, hold SHIFT while scrolling.
Trace Timeline
The trace timeline will be docked on the right side of the disassembler. This widget is used to visualize different types of events along the trace timeline and perform basic navigation as described above.
By clicking and dragging across the timeline, it is possible to zoom in on a specific section of the execution trace. This action can be repeated any number of times to reach the desired granularity.
Execution Breakpoints
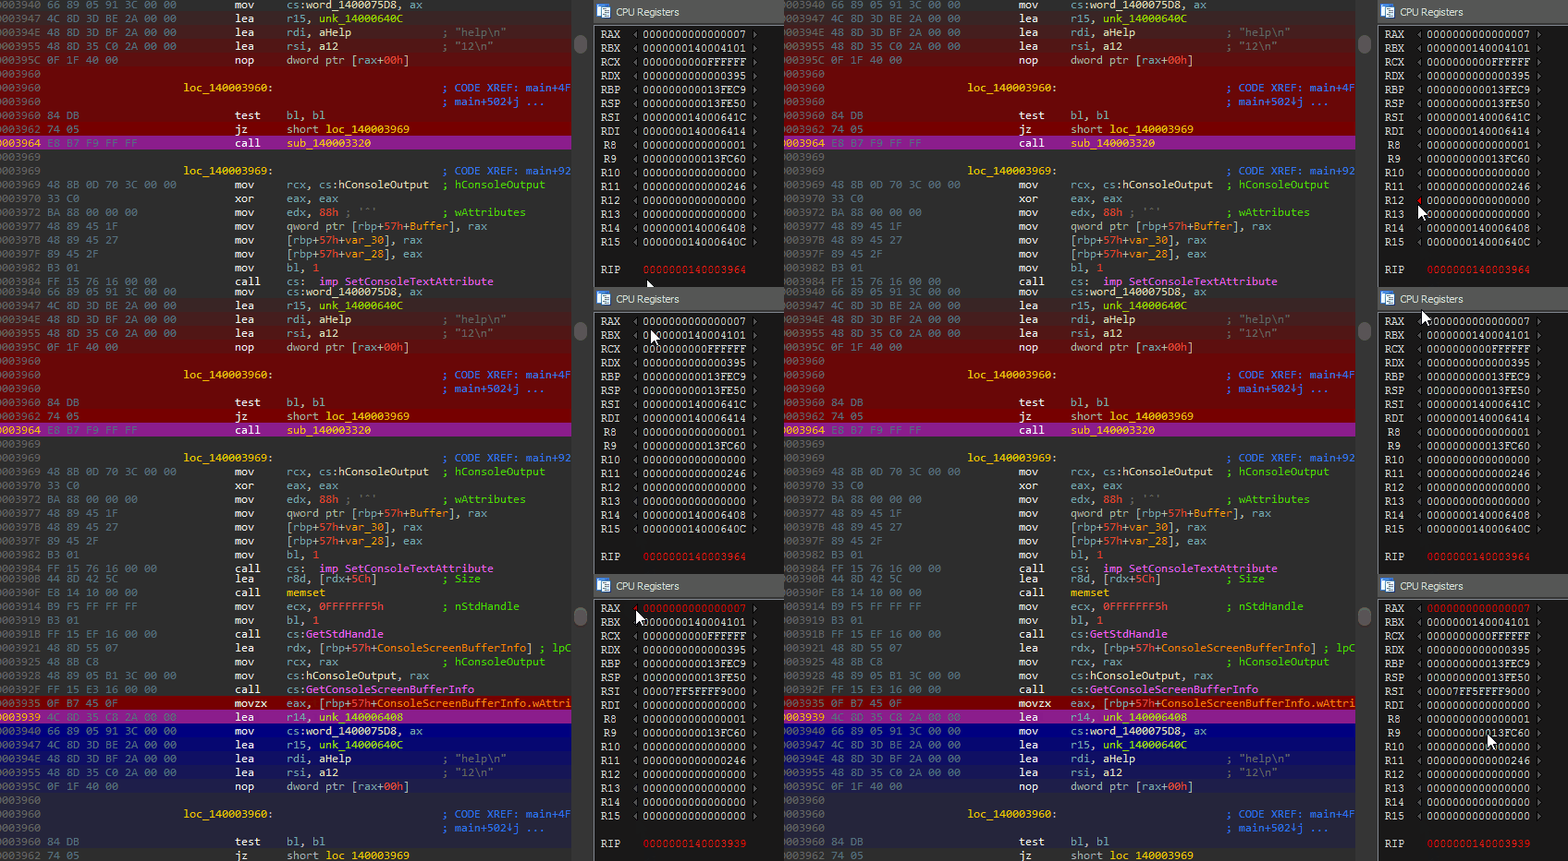
Clicking the instruction pointer in the registers window will highlight it in red, revealing all the locations the instruction was executed across the trace timeline.
To jump between executions, scroll up or down while hovering the highlighted instruction pointer.
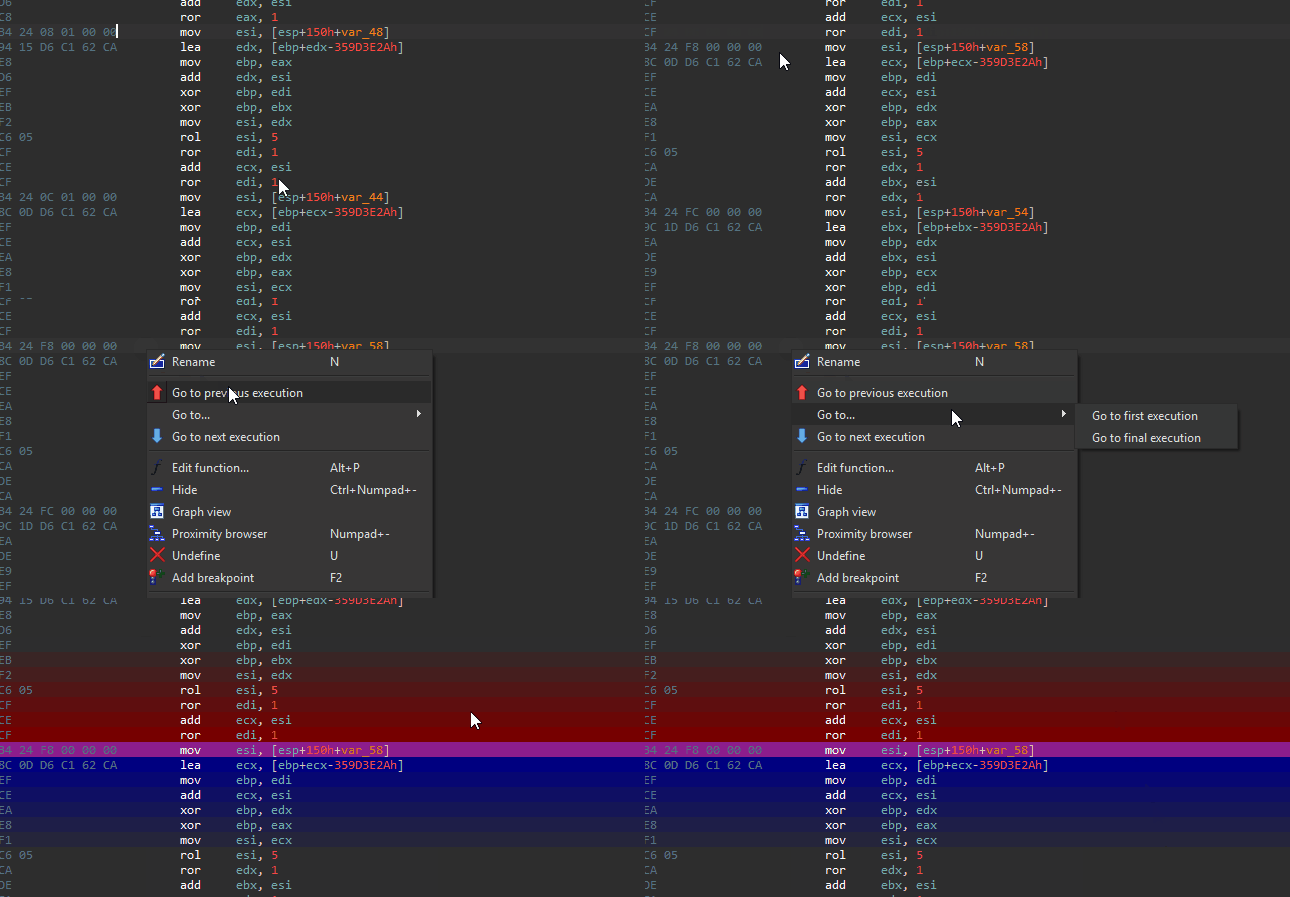
Additionally, you can right click in the disassembly listing and select one of the navigation-based menu entries to quickly seek to the execution of an instruction of interest.
IDA’s native F2 hotkey can also be used to set breakpoints on arbitrary instructions.
Memory Breakpoints
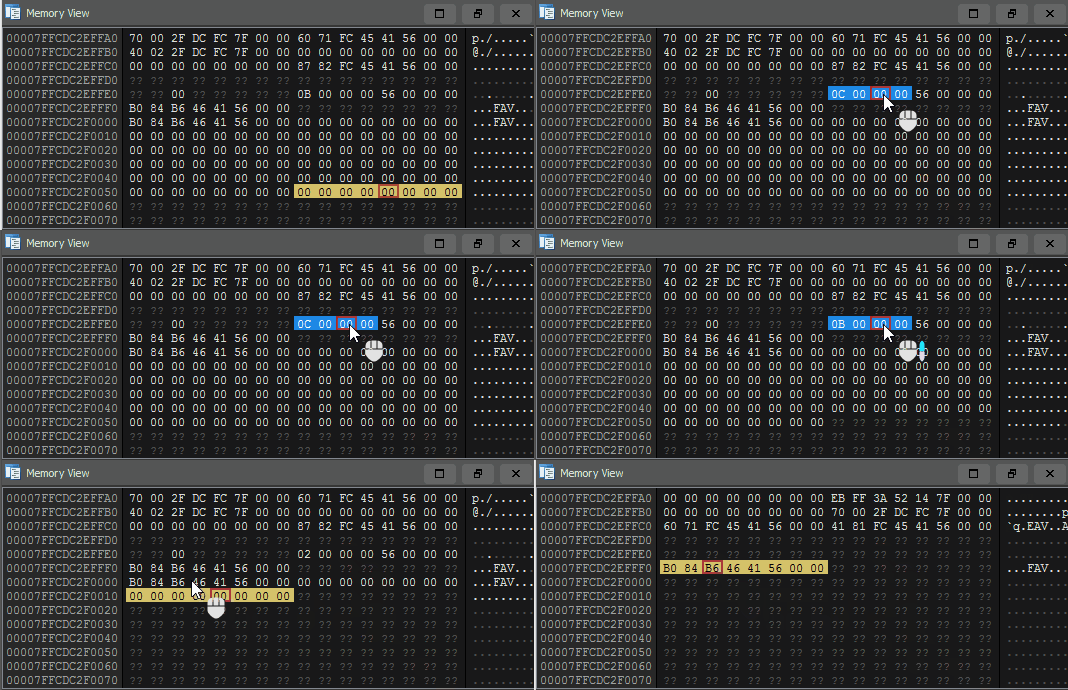
By clicking a byte in either the stack or memory views, you will instantly see all reads/writes to that address visualized across the trace timeline. Yellow indicates a memory read, blue indicates a memory write.
Memory breakpoints can be navigated using the same technique described for execution breakpoints. Click a byte, and scroll while hovering the selected byte to seek the trace to each of its accesses.
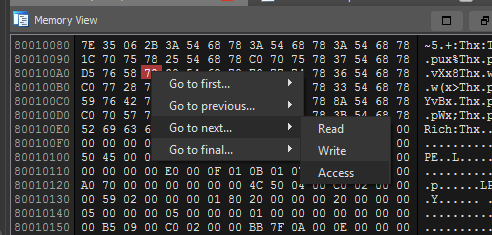
Right clicking a byte of interest will give you options to seek between memory read / write / access if there is a specific navigation action that you have in mind.
To navigate the memory view to an arbitrary address, click onto the memory view and hit G to enter either an address or database symbol to seek the view to.
Region Breakpoints
A rather experimental feature is setting access breakpoints for a region of memory. This is possible by highlighting a block of memory, and selecting the Find accesses action from the right click menu.
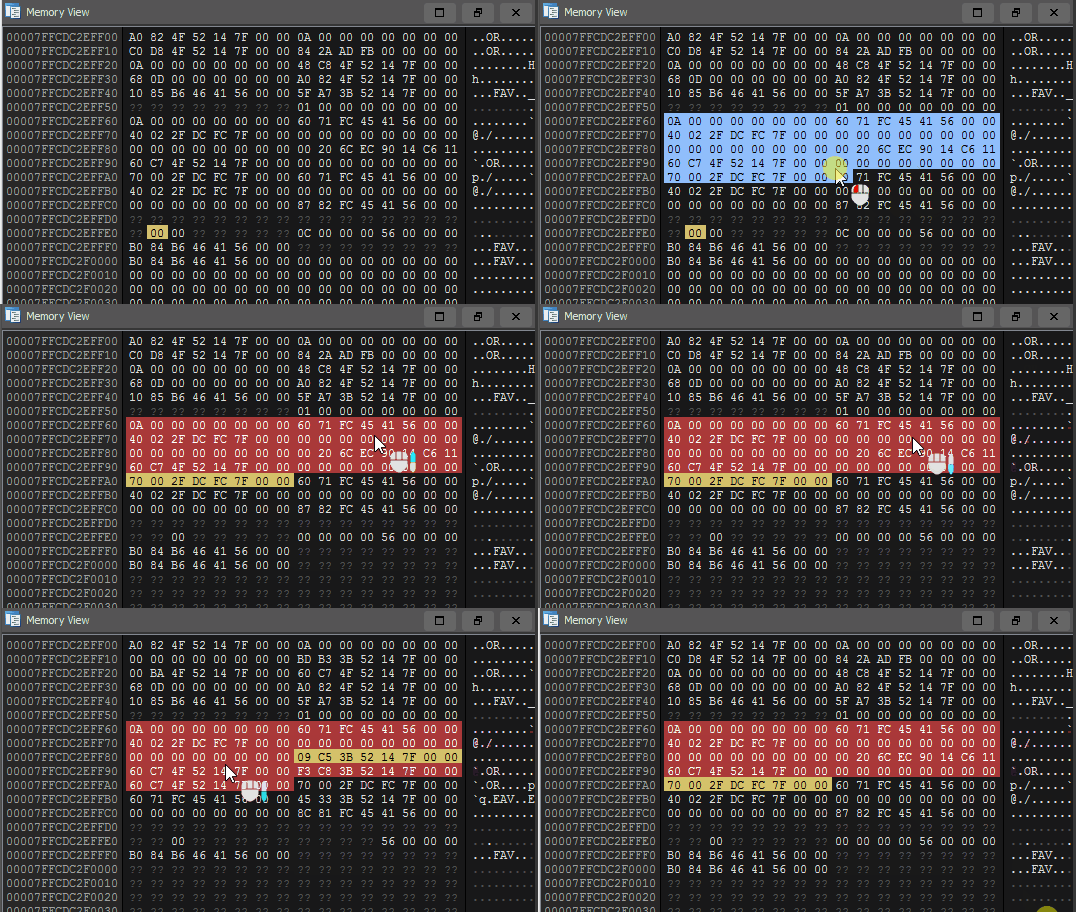
Tenet allows you to set a memory access breakpoint over a region of memory, and navigate between its accesses
As with normal memory breakpoints, hovering the region and scrolling can used to traverse between the accesses made to the selected region of memory.
Register Seeking
In reverse engineering, it’s pretty common to encounter situations where you ask yourself “Which instruction set this register to its current value?”
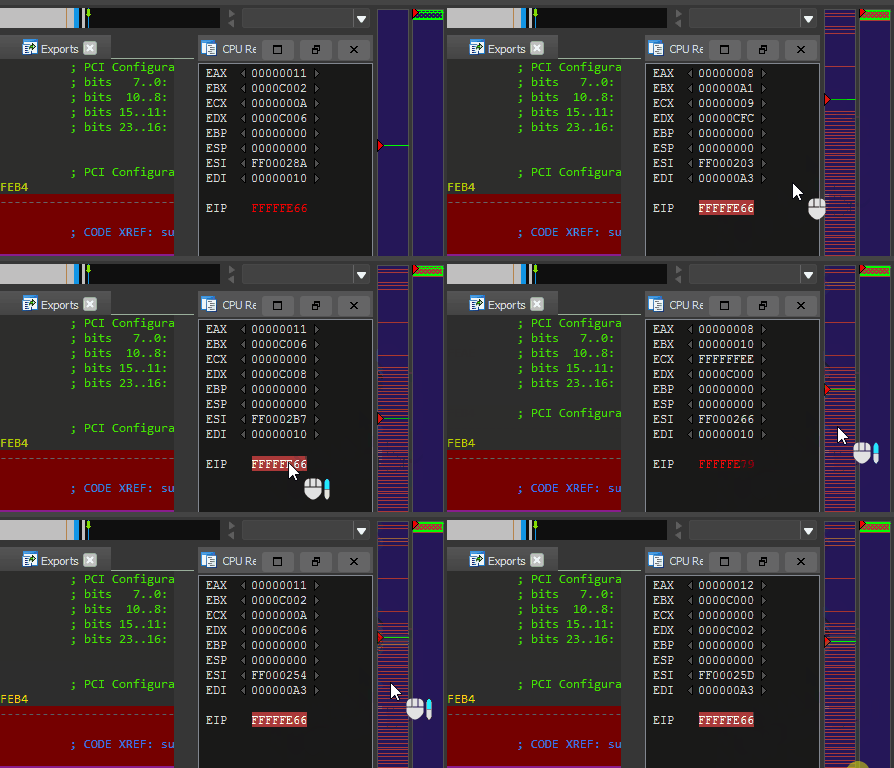
Using Tenet, you can seek backwards to that instruction in a single click.
Seeking backwards is by far the most common direction to navigate across register changes… but for dexterity you can also seek forward to the next register assignment using the blue arrow on the right of the register.
Timestamp Shell
A simple ‘shell’ is provided to navigate to specific timestamps in the trace. Pasting (or typing…) a timestamp into the shell with or without commas will suffice.
Using an exclamation point, you can also seek a specified ‘percentage’ into the trace. Entering !100 will seek to the final instruction in the trace, where !50 will seek approximately 50% of the way through the trace.
Themes
Tenet ships with two default themes – a ‘light’ theme, and a ‘dark’ one. Depending on the colors currently used by your disassembler, Tenet will attempt to select the theme that seems most appropriate.
The theme files are stored as simple JSON on disk and are highly configurable. If you are not happy with the default themes or colors, you can create your own themes and simply drop them in the user theme directory.
Tenet will remember your theme preference for future loads and uses.
Open Source
Tenet is currently an unfunded research project. It is available for free on GitHub, published under the MIT license. In the public README, there is additional information on how to get started, future ideas, and even an FAQ that have not been covered in this post.
Without funding, the time I can devote to this project is limited. If your organization is excited by the ideas put forth here and capable of providing capital to sponsor dedicated development time towards Tenet, please contact us.
Related Works
There aren’t many robust projects (or products) in this space, and it’s important to raise awareness for the few that exist. If you found this blogpost interesting, please consider exploring and supporting more of these technologies:
- QIRA – QEMU Interactive Runtime Analyser
- Microsoft TTD – Time Travel Debugging for Windows
- RR // Pernosco – Timeless debugging for Linux
- PANDA – Full system tracing, built on QEMU
- REVEN – Full system tracing, built on PANDA / VirtualBox
- UndoDB – Reversible debugging for Linux and Android
- DejaVM – :^)
Conclusion
In this post, we presented a new IDA Pro plugin called Tenet. It is an experimental plugin designed to explore software execution traces. It can be used both as an aid in the reverse engineering process, and a research technology to explore new ideas in program analysis, visualization, and the efficacy of next generation debugging experiences.
Our experience developing for these technologies is second to none. RET2 is happy to consult in these spaces, providing plugin development services, the addition of custom features to existing works, or other unique opportunities with regard to security tooling. If your organization has a need for this expertise, please feel free to reach out.

