Vulnerability Discovery Against Apple Safari
Evaluating Complex Software Targets for Exploitable Vulnerabilities
Vulnerability discovery is the first stage of the exploit development lifecycle. The duration of this phase is open-ended because the search space, code quality, and evaluation process for a given target can vary wildly. Deciding between manual and automated vulnerability discovery is often a question of priorities and can be difficult to balance effectively.
As part two of our Pwn2Own 2018 blogpost series, we will discuss our methodology of researching a complex software target (the Safari Web Browser), narrowing our scope of evaluation, selecting a vulnerability discovery strategy, and developing a browser fuzzer unique to this engagement.
For a top-level discussion of this blog series and our entire Pwn2Own 2018 exploit-chain, check out part one.
Reconnaissance 101
Faced with millions of lines of code, discovering vulnerabilities against large-scale software can be an overwhelming experience. To overcome this, it is vital to build foundational knowledge about the target, and one of the least-glamorous parts of the zero-day development process. This is basic reconnaissance 101.
What does the software do? How does the user interact with the software? How is the project architected? What are its major components? What does its past vulnerabilities look like?
This step literally comes down to aggregating documentation or security literature that is relevant to your target, and spending time to pore over it. Build lists of links and take notes, but don’t try to understand everything.
If there is no public research or documentation on your explicit target, it can be useful to review materials for related targets (eg, Google’s v8, Mozilla’s SpiderMonkey, Microsoft’s Chakra, etc) or devices (if attacking hardware).
Skipping this step simply means you will spend 10x longer making the same discoveries that were already distilled for you by these resources.
WebKit: Zeroing in on a Target
When dealing with small-to-medium sized targets, it is often feasible to simply target everything… but this becomes exponentially harder when targeting codebases that grow in size and complexity.
Using knowledge learned through the study of existing literature (recon 101), it is important to aggressively reduce the scope of what you believe worthwhile to evaluate until you are left with a manageable amount of attack-surface.
We applied this same strategy to limit our intended scope of evaluation for WebKit from over 3 million lines of C/C++ to less than 70k. By limiting breadth, we hope to increase the depth and quality of the evaluation we can perform on a very targeted subset of the codebase.
For Pwn2Own 2018 we chose to focus specifically on JavaScriptCore, the JS engine within Safari. This decision was an informed one, based on reviewing existing research. While bugs in JS engines are becoming increasingly rare, the highly exploitable nature of these vulnerabilities are hard not to pine over.
Selecting JavaScriptCore is a huge reduction of scope, but even JSC is sizable at ~350k lines of C/C++. To help familiarize ourselves with the codebase, we chose to contract our scope further to its most ‘approachable’ code.

A treemap visualization of the JavaScriptCore source directory. The JavaScript runtime is highlighted in red
The C/C++ code that makes up the JS runtime (highlighted above in red) maps almost directly to the high level objects used while writing JavaScript. The runtime is effectively the surface layer of any JS engine.
This high level layer lives mostly in /Source/JavaScriptCore/runtime:
Scoped to just JSC’s runtime folder, we are down to ~70k lines of code. This figure is still pretty substantial, but the reduced scope has shaped a more approachable task. What is considered ‘reasonable’ will depend on the resources (time, money, people) and discovery strategy you plan to employ.
Having selected a target, it is time to select an approach towards vulnerability discovery.
Evaluation Strategy
There are two distinct methods of effective software (security) evaluation. Picking between them is naively one of individual preference, but should otherwise be a choice driven by underlying priorities and motivations.
Fuzzing is the goto strategy for many security enthusiasts because it is often low cost and fruitful. Fuzzers can cover large amounts of attack surface in a small amount of time, but at the cost of depth and ‘creativity’ that we as humans can provide. Quickly finding bugs with a fuzzer feels rewarding, but can also be a red flag that someone else out there has found the same thing. These bugs often have a shorter shelf life.
Source review is both tedious and demoralizing on well vetted code. But for those who persist, it often leads to deeply rooted bugs which are out of reach for most fuzzers and even some fellow reviewers. These bugs tend to be longer lasting, and frequently used in trade.
For this engagement, it made sense for us to use a fuzzing heavy approach. The layer we scoped for JSC was an ambitious target as it has been heavily picked over through the years. It is shallow, and among the most vetted code in WebKit by fuzzers or source reviewers alike. Bugs found in this area are unlikely to last long-term in today’s climate.
The remainder of this post details the approach and considerations we weighed while building a JS fuzzer.
Grammar Based Fuzzing
Classic fuzzing techniques, such as bit-flipping, simple input mutation, and testcase-splicing are generally unusable for highly structured contextual input like an interpreted language (JavaScript). To fuzz these inputs, the best approach is to synthesize syntactically correct and semantically reasonable testcases using grammars.
Practically speaking, grammars are often handwritten by an analyst as a set of ‘rules’ for structuring data. As an example, let’s write some a simple grammar to generate math expressions:
digit :=
    1
    2
    3
    ...

operator :=
    +
    -
    *
    ...
Using these ‘language’ primitives, we can build new higher level grammar structures (math expressions):
expr :=
    +digit+ +operator+ +digit+
To concretize the concept, we ask our testcase generator to consume the grammar rules we wrote, and produce an arbitrary number of random expr as output:
1 + 1
1 * 2
3 - 2
2 + 3
...
The same idea can be extrapolated to much more complex tasks, such as generating syntactically valid JavaScript code. This boils down to reading specs and translating them to grammar definitions.
Synthesizing JavaScript with Grammars
Our fuzzer’s JS testcase generation was powered by grammars we pushed through a custom version of Mozilla’s dharma, extended to include some convenience methods that allowed us to generate more ‘interdependent’ code.
We supplied (eg, wrote) two categories of JS grammars for dharma: Libraries and Drivers.
Library grammars served three major purposes:
- Defining rules to initialize a particular JavaScript object or type (Arrays, Strings, Maps, etc)
- Defining rules to generate all valid member functions against that object or type (eg, array.sort())
- Defining Collections of syntactically or semantically similar rules
Driver grammars provided high-level scaffolding between our library grammars. Typically, driver grammars would first initialize a set of distinct JavaScript variables using rules previously defined in libraries. Following that, they generated randomized constructs which:
- Forced interactions between JavaScript variables
- Modified, deleted, or reinitialized the variables at random points
- Called appropriate member functions against variables based on their type
Collections allowed us to express high-level ‘guidelines’ in our driver grammars. As an example, let’s look at some of the collections we wrote for JSArray objects:
CallbackMethod :=
    +every+
    +filter+
    +reduce+
	...

InPlaceMethod :=
    +sort+
    +splice+
    +shift+
    ...
If we wanted an Array to randomly modify itself only one of many ways on occassion, we could include a single +JSArray:InPlaceMethod+ statement in whatever larger grammar construct we were building. Without Collections, we would have had to manually specify each individual possibility.
Each entry in a collection would generate a randomly chosen signature of that particular member function (or API), potentially firing off generation of other JavaScript constructs as necessary:
sort :=
    sort()
    sort(+GenericFunc:TwoArgNumericCmp+)
    ...
This gave us the flexibility of being very vague when writing driver grammars. We only had to provide rough boundaries for testcase-generation, then let chance dictate what happened between them.
We ended up doing the majority of our fuzzing using one ‘mega-driver’. This grammar would initialize variables from every library grammar we wrote, then chaotically generate actions against them:
Originally, this grammar was intended as the ‘control’ against which we would collect code coverage and improve the underlying library grammars. The plan was to later build more interesting context and state with the driver grammars once we had good coverage on runtime functionality.
This didn’t ended up happening because we found an exploitable issue while building out our library grammars.
A Scalable Fuzzing Harness
While building up the JS grammars for better testcase generation, we developed yet-another-distributed-and-scalable-fuzzing-harness in Python. With tradition, the harness infrastructure was architected to use a single ‘master’ node, with an arbitrary number of ‘worker’ nodes.
The master node was responsible for:
- Managing workers’ configuration
- Triaging worker reported crashes & testcases into buckets
- Consolidating code-coverage metrics collected by workers
Consequently the workers’ responsibilities included:
- Testcase generation
- Launching testcases under JSC and reporting crashes
- Collecting code-coverage data over a random sampling of testcases
We fuzzed on the worker nodes against a debug build of JSC, compiled with ASAN, running on Ubuntu 16.04. We made no special modifications to the JavaScriptCore codebase for the purpose of this engagement.
Coverage for an Abstract Corpus
A small percentage of the time, our harness would use DynamoRIO to collect code coverage against a random sampling of JSC executions. The harness would aggregate all code coverage information as a rough approximation to the corpus our JS grammars were capable of generating for JSC.
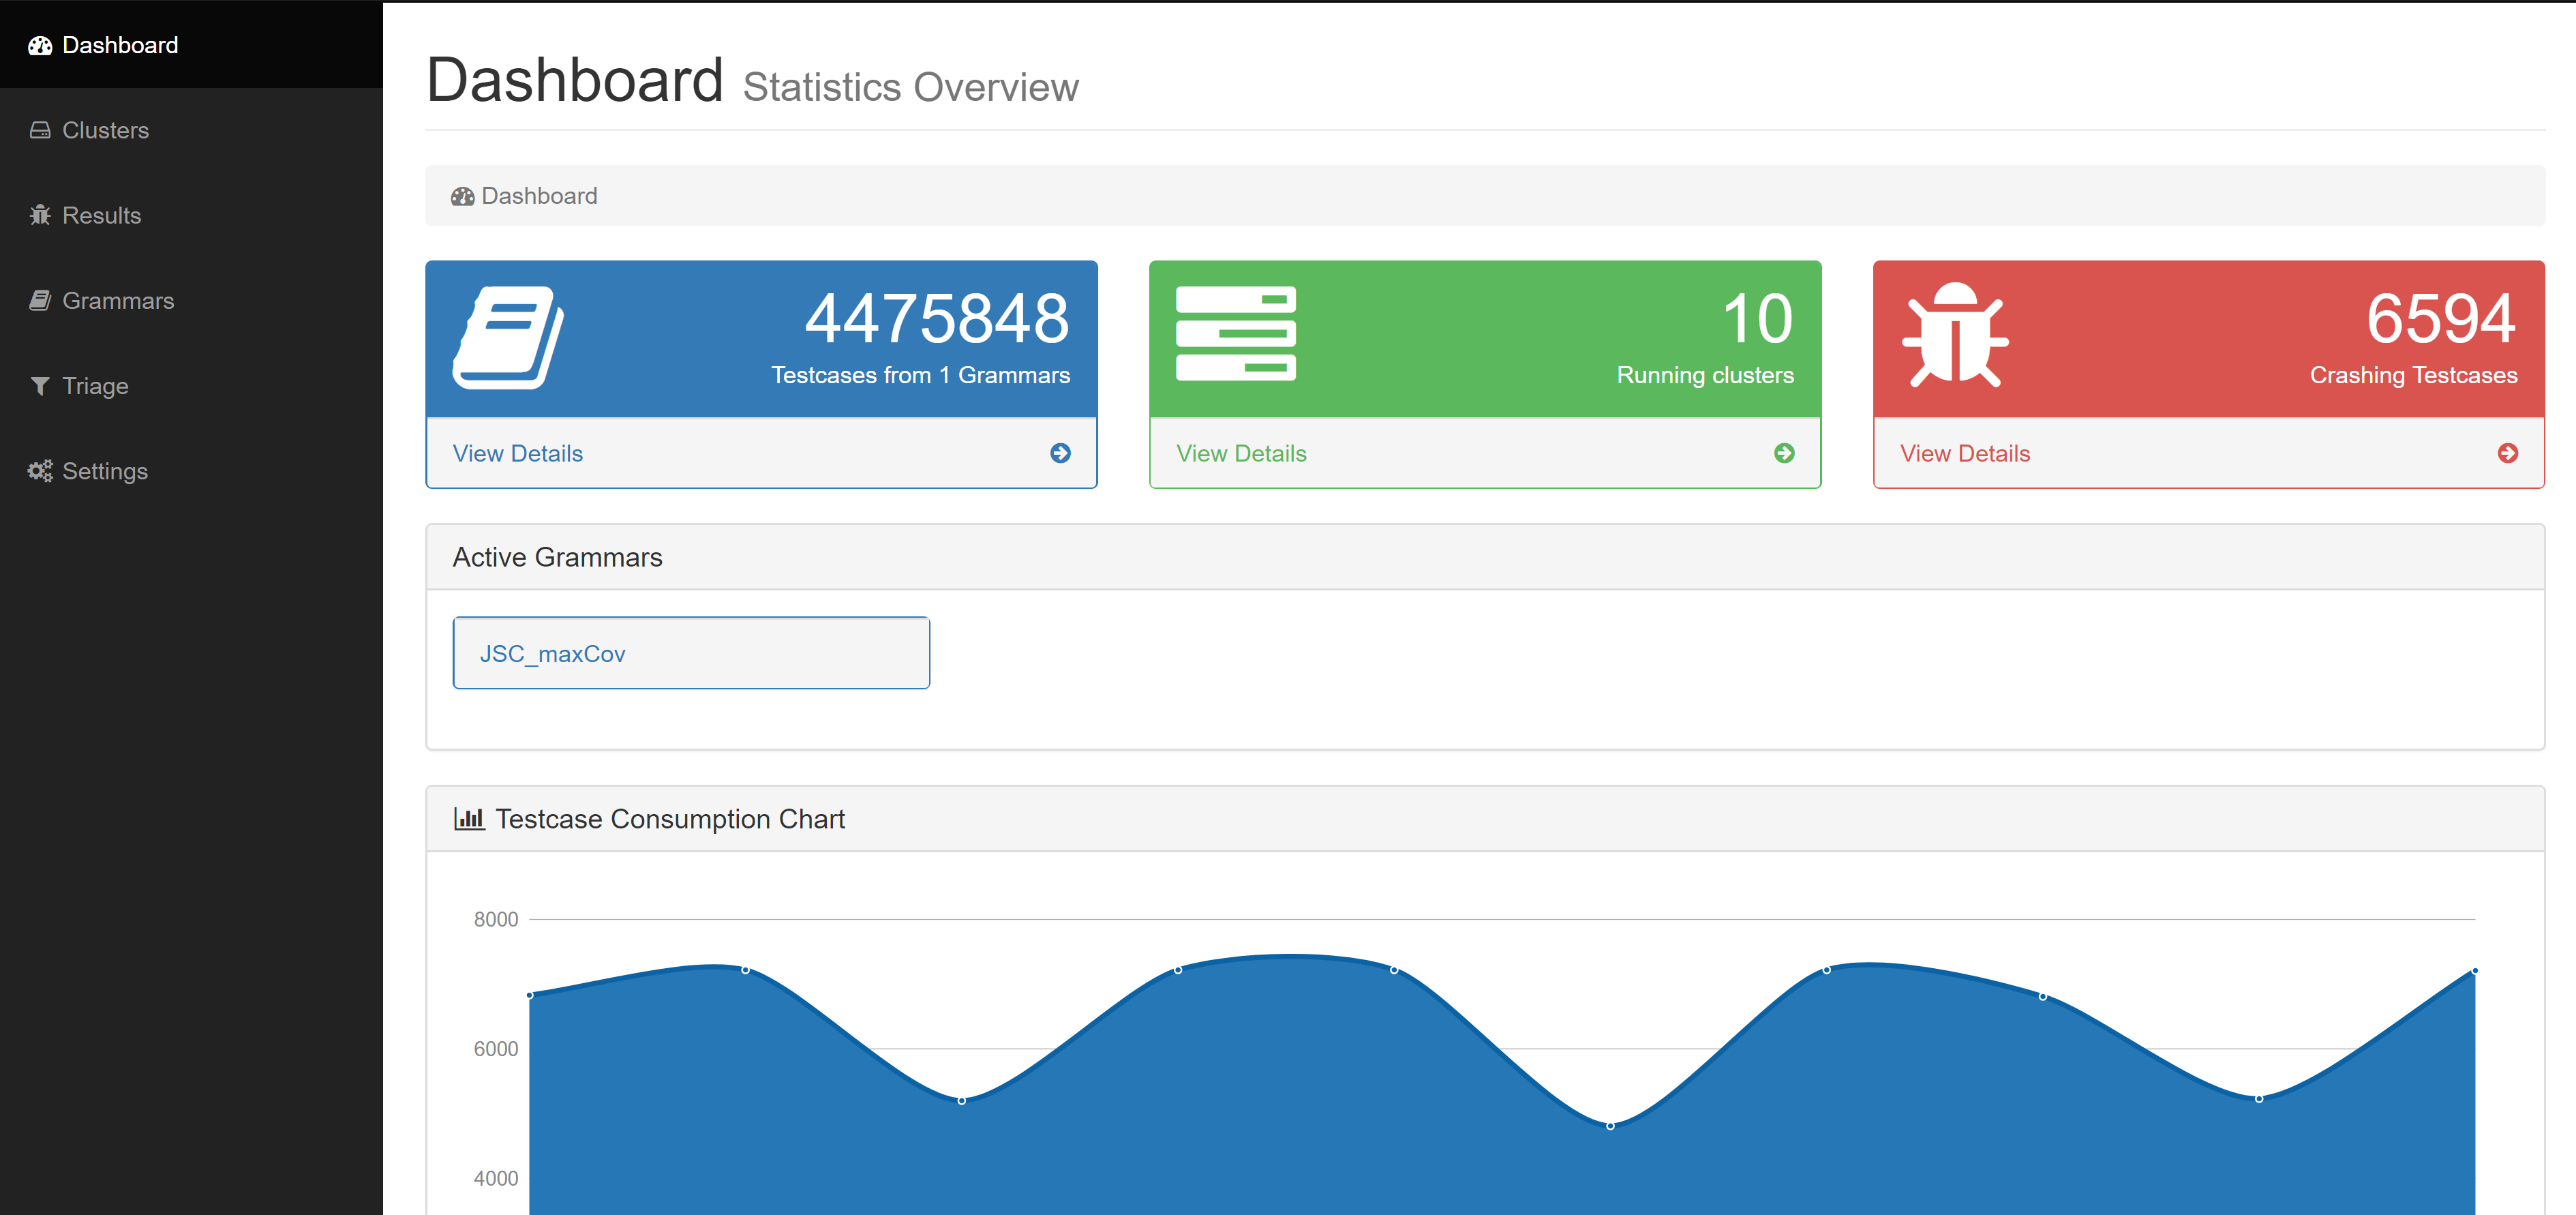
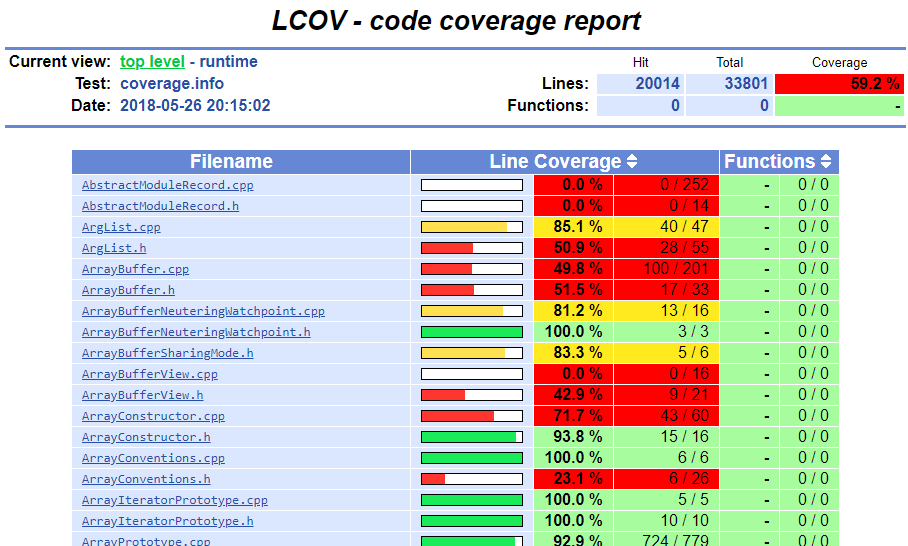
On the master node, we automatically generated and exposed an lcov report in the dashboard to get a quick visual approximation of our overall code coverage. This report would update every few minutes by aggregating any new coverage data from the workers, making it convenient to track our grammar improvements in real time.
On occasion, we would also download and explore the running coverage aggregate using Lighthouse. Our harness explicitly collected coverage against release builds of JSC with compile time optimizations and inlining disabled so that we had a cleaner view in the disassembler.
Although it may seem counterintuitive to evaluate coverage at the assembly level when source is available, getting ‘closer to the metal’ has its advantages:
- ‘Zooming in’ on tricky edge cases is more natural in a disassembler
- Lighthouse is much more interactive than the static HTML report generated by lcov
- Lighthouse gives us detailed function level properties & coverage statistics to sort and prioritize by
- C++ templated code can have one source implementation, but many binary functions could be emitted for them
This combination of tooling gave us valuable insight towards tuning grammars to ensure coverage over edge-cases, non-standard modes of operation, and notable execution gaps within the JSC runtime.
We hoped to use coverage to augment and guide our own manual source review once we got things rolling, but as mentioned in the grammars section, we were cut short by premature discovery.
Vulnerability Discovery
As our grammar ‘corpus’ began to surpass ~50% code coverage for our scoped target (the runtime folder), we began to see a number of unique crashes. This is not uncommon when fuzzing is complemented by good coverage visibility. We were targeting >60% code coverage, and the hard fought final few percentage points (edge cases, uncommon code) are where bugs often shake out.
As we triaged these new crashes, we noticed one with a particularly intriguing callstack:
After minimizing the crashing testcase, we were left with the following Proof-of-Concept (PoC):
// initialize a JSArray (someArray1), with more JSArrays []
var someArray1 = Array(20009);
for (var i = 0; i < someArray1.length; i++) {
    someArray1[i] = [];
}

// ???
for(var index = 0; index < 3; index++) {
    someArray1.map(
        async function(cval, c_index, c_array) {
            c_array.reverse();
        });
}

// print array contents & debug info
for (var i = 0; i < someArray1.length; i++) {
    print(i);
    print(someArray1[i].toString());
}
print(describeArray(someArray1))
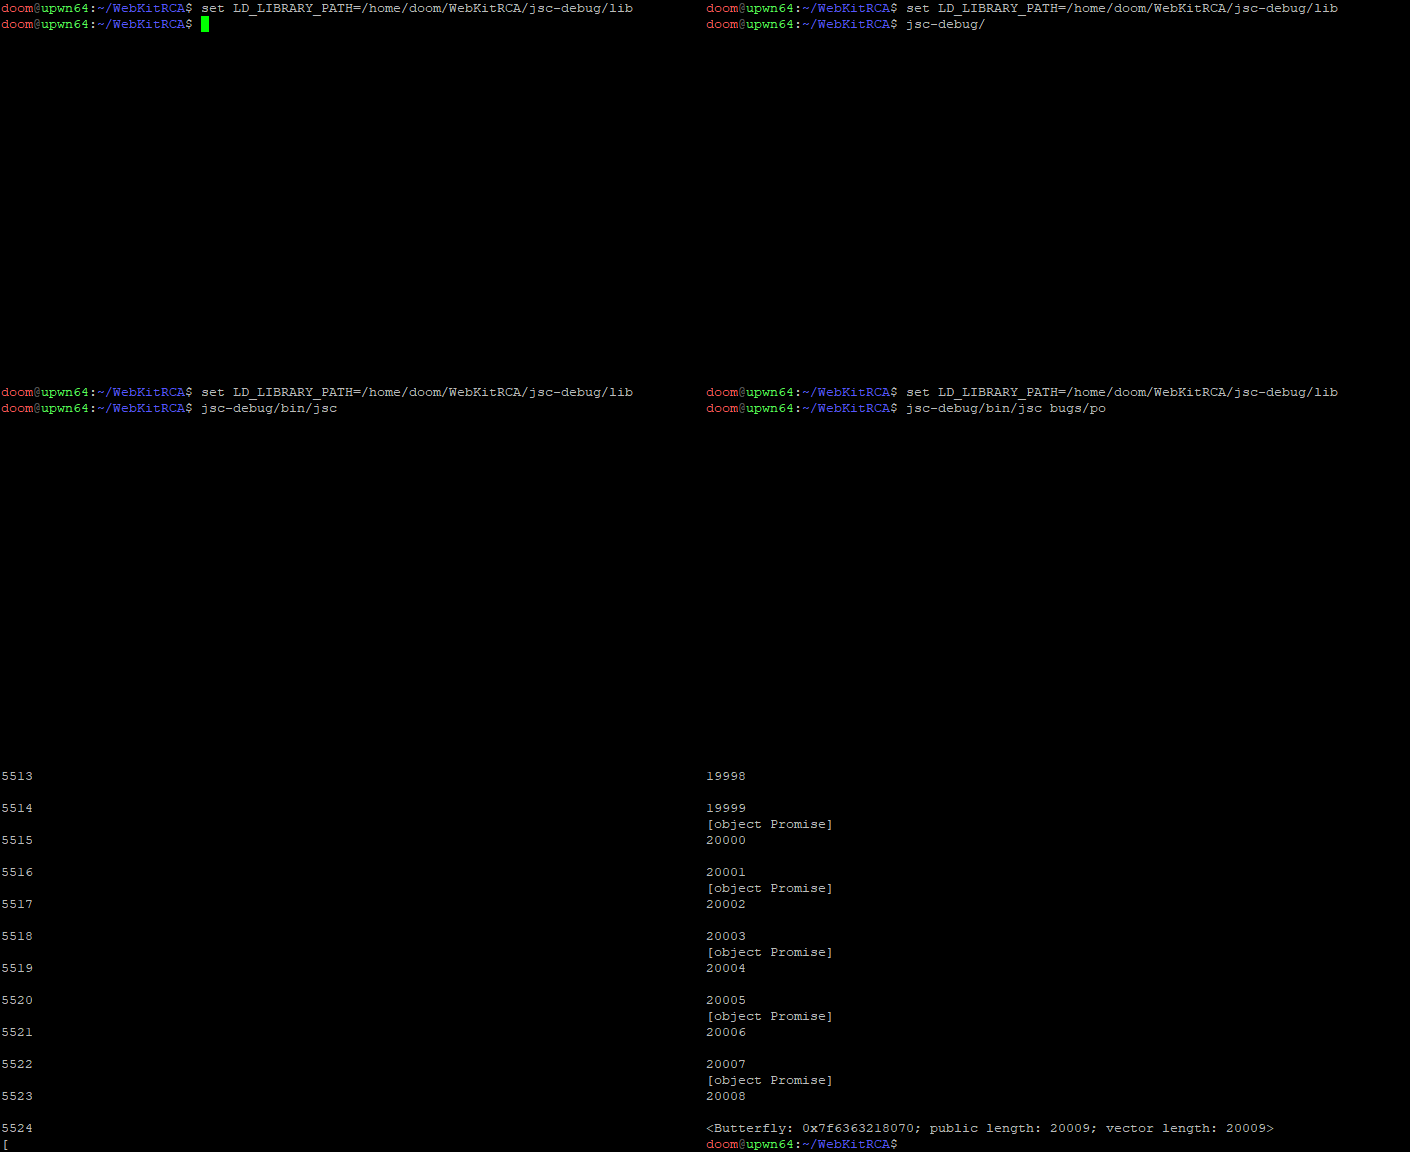
This script (poc.js) would intermittently demonstrate some abnormal behavior that we believed to be responsible for the original JSC crash caught by the fuzzing harness.
Running the testcase through JSC a few times, we can observe an unexplainable phenomenon where a number of JSPromise objects can randomly get stored within someArray1:
This should never happen. someArray1 should only ever contain the JSArrays created in the first step of our minimized testcase. There is something very wrong happening here.
Conclusion
Evaluating any sufficiently large piece of software for security vulnerabilities is an inherently difficult undertaking. In this post we discussed strategies to research targets, reduce scope, and apply custom tooling as essential methods for managing the intrinsic complexity of this process.
In our next blogpost, we’ll detail the use of advanced debugging technologies to perform root cause analysis (RCA) on the suspicious testcase we minimized (a JSC bug). Based on our understanding of the underlying issue, we can then draw an informed conclusion as to its true security implications.


